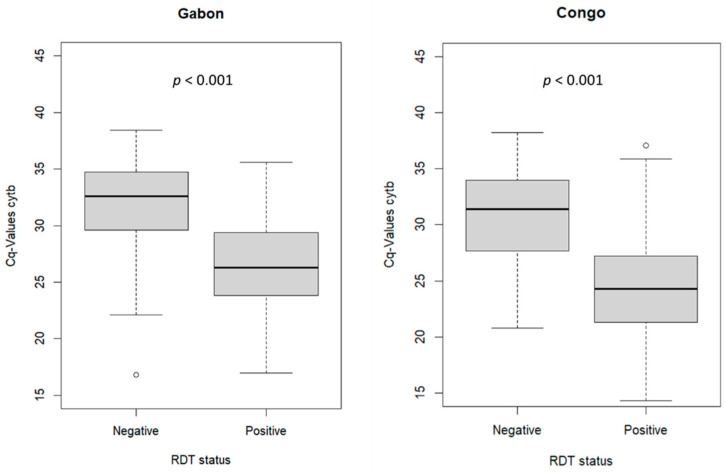
Figure A2.
Boxplot comparing P. falciparum/pfcytb Cq-values of RDT false-negative samples and RDT true-positive samples. Median and inter-quartile ranges (IQR) are displayed with whiskers in the style of Tukey (extends to the smallest/largest value no further than 1.5 × IQR (inter-quartile range) from the hinge with outliers depicted as circles); Cq—cycle of quantification.

