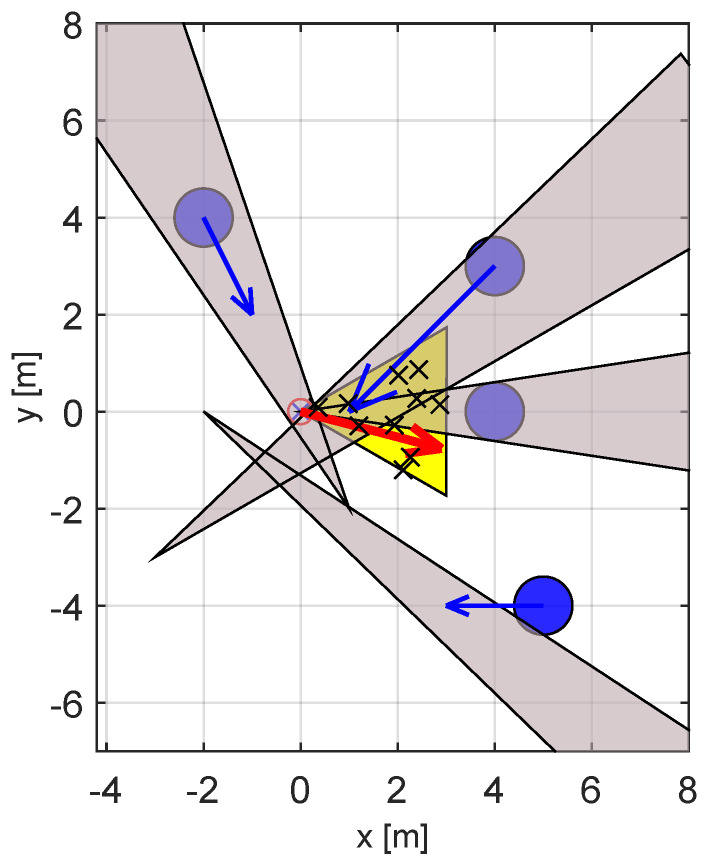
Figure 10.
VO−type diagram of the crowded scenario. The robot is positioned in the origin and is denoted by a red circle, the goal position is at [8,0]. The yellow area represents the reachable available velocities, with the red arrow being the optimal velocity corresponding to the fastest solution. The blue disks represent the obstacles with their velocities, while the gray triangles are the corresponding VOs. The x-marks distributed within the area of reachable velocities are the initial population of the GAVO variants. The fact the majority of the yellow area is covered by the VOs shows that this is a “difficult” scenario.

