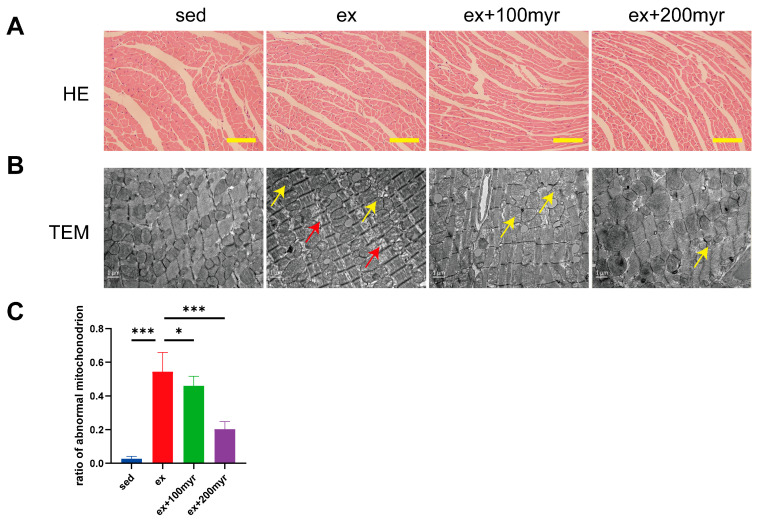
Figure 2.
Effect of myricetin on myocardial pathology. (A) Representative HE staining results. Scale bar in the figure is 100 μm; (B) representative transmission electron microscopy results; scale bar in the figure is 1 nm, magnification 15,000×; and (C) proportion of abnormal mitochondria. Yellow arrows indicate sparse arrangement of myocardial fibers, and red arrows indicate swollen and dissolved mitochondrial cristae. The data are presented as mean ± SD. * p < 0.05; *** p < 0.001.

