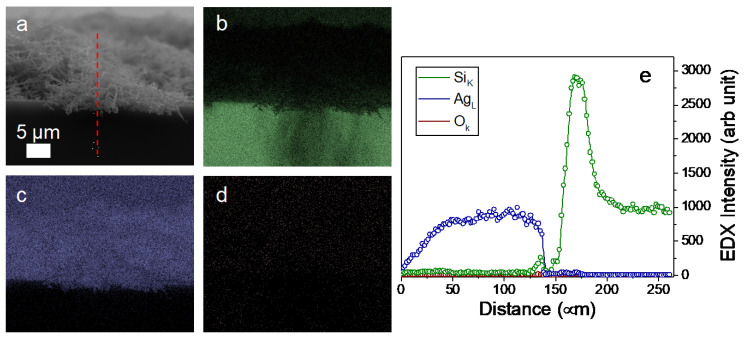
Figure 2.
Compositional map of the Ag dendrite samples obtained by energy dispersive X-ray spectroscopy (EDX). (a) SEM image in cross configuration of the sample. (b) Silicon map (in green), (c) Ag map (in blue), and (d) O map (in red). (e) EDX profilometry elemental analysis for silicon, silver, and oxygen performed along the red dashed line shown in (a).

