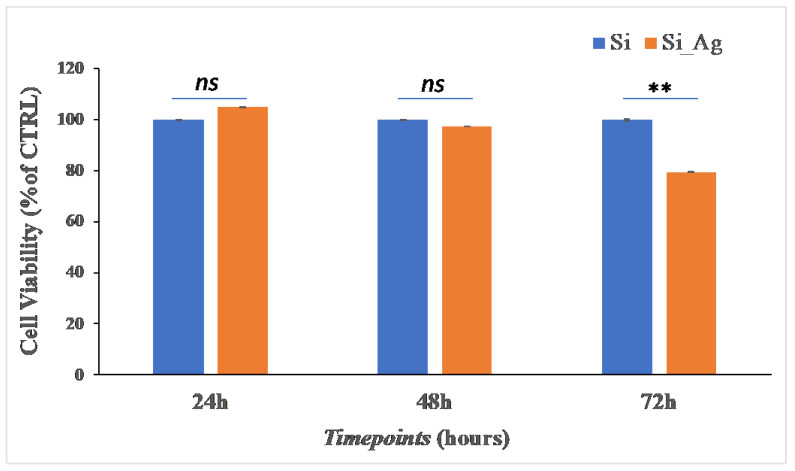
Figure 3.
Cell viability. MTT analysis on hFOB grown on the surface of Si_Ag for 24, 48, and 72 h compared to the control (Si). Data are reported as mean ± standard deviation obtained from 3 different samples. ** p < 0.01 shows significant differences between the two samples to the same timepoint, as reported by a t-test; ns = not significant.

