Figure 4.
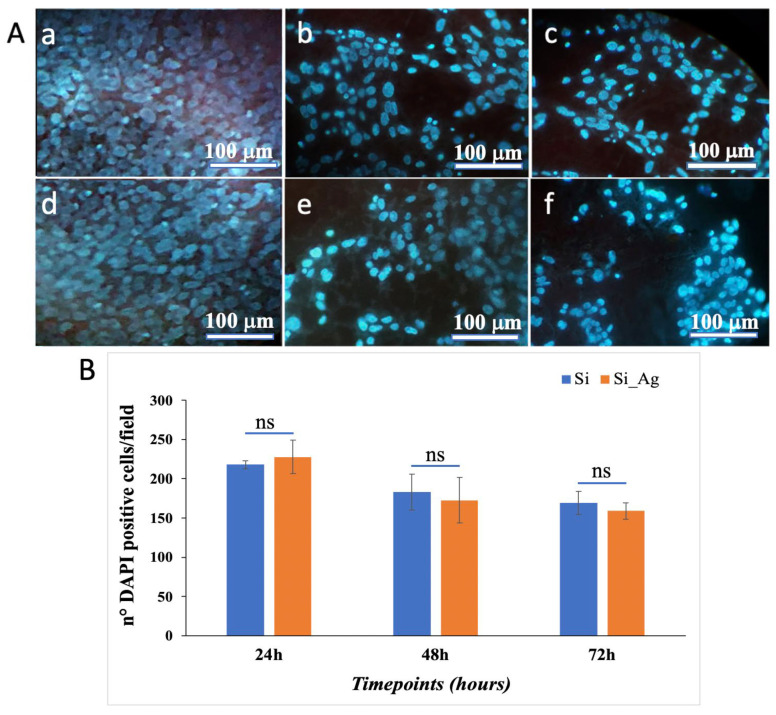
Cell proliferation. (A) Representative DAPI staining images of hFOB grown on the surface of the Si bulk substrate (a–c) and Ag dendrites (d–f) for 24, 48, and 72 h. (B) Graphical representation of DAPI positive cells/field. Data are reported as mean ± standard deviation obtained in 4 different fields; ns = not significant.

