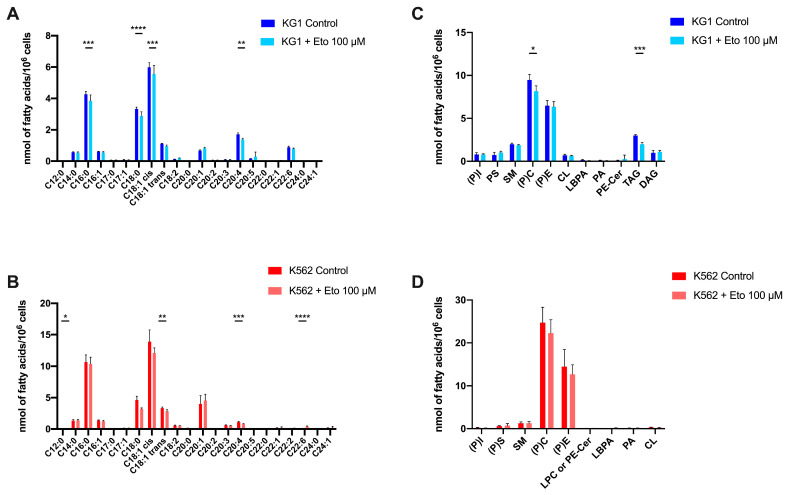
Figure 4.
Impact of a low dose of etomoxir on the two cell lines KG1 and K562. (A,B) Composition of total fatty acids in KG1 and K562, respectively, at basal state versus with 100 µM etomoxir. (C,D) Lipid species quantification in KG1 and K562, respectively, at basal state versus with 100 µM etomoxir. * p < 0.05, ** p < 0.01, *** p < 0.001, **** p < 0.0001.

