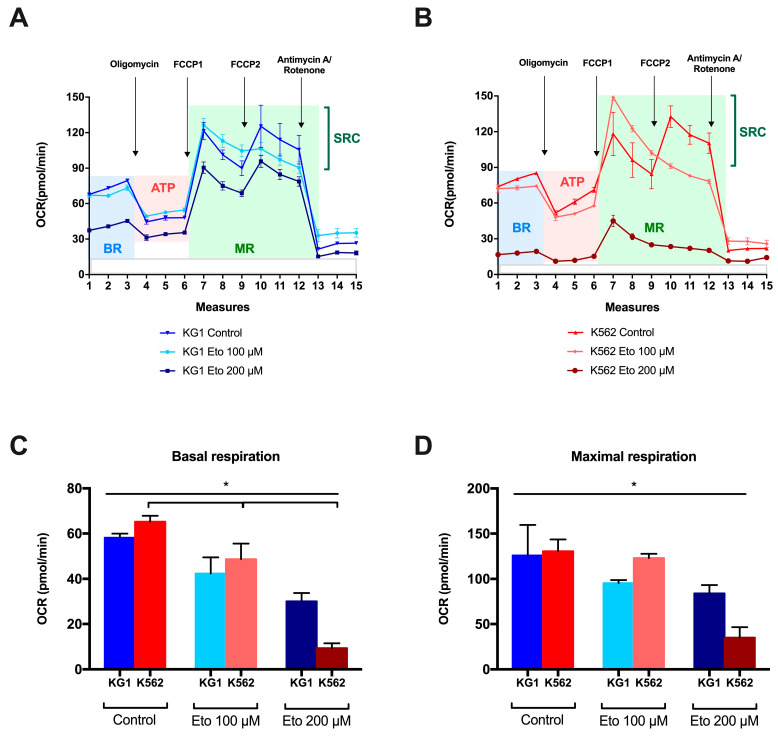
Figure 5.
Variation in the respiratory profiles of the two cell lines KG1 and K562 at 24 h of culture. The profiles of the key parameters of KG1 (A) and K562 (B) in their basal state, and with increasing concentrations of etomoxir (100 and 200 µM) are presented, as are the OCR variations in basal respiration (C) and maximal respiration (D). * p < 0.05. Abbreviations: ATP: adenosine triphosphate, BR: basal respiration, FCCP: carbonyl cyanide p-trifluoro-methoxyphenyl hydrazone, MR: maximal respiration, OCR: oxygen consumption rate, SRC: spare respiratory capacity.

