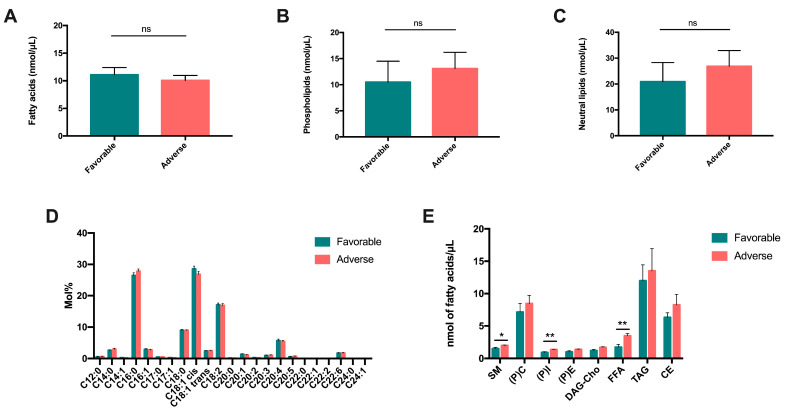
Figure 6.
Variation in fatty acid content and lipid species in AML patients according to their prognosis. The amounts of total fatty acids (A), phospholipids (B) and neutral lipids (C) were quantified in patients with favorable and adverse prognoses. (D) Composition of total fatty acids in plasma of patients with favorable and adverse prognoses. (E) Lipid species quantification in plasma of patients with favorable (n = 5) versus adverse (n = 5) prognoses. ns: non-significant, * p < 0.05, ** p < 0.01.

