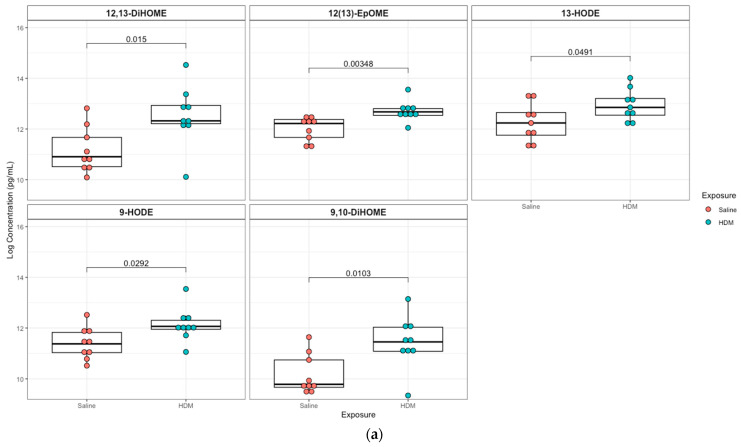
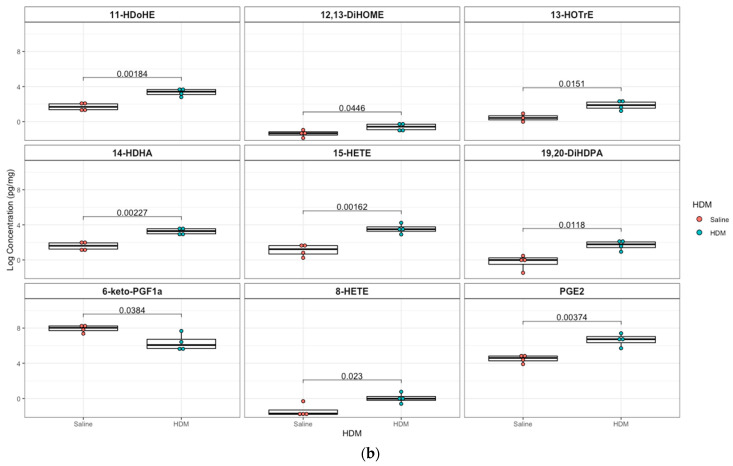
Figure 4.
Box plots of significantly different oxylipins between house dust mite (HDM)-sensitized and control mice plasma and lung tissue. (a) Significantly different oxylipins in mice plasma (see Figure S5 for all oxylipins). (b) Significantly different oxylipins in mice lung tissue (see Figure S6 for all oxylipins). The t-test was used for statistical comparison for HDM-sensitized and control. p-values provided for each lipid panel were not adjusted for multiple testing.


