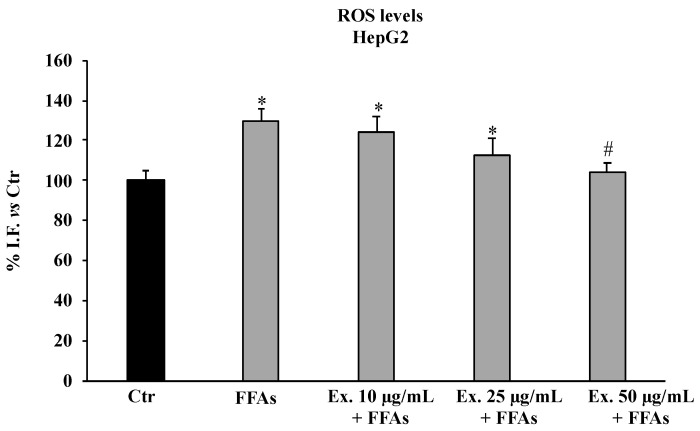
Figure 3.
ROS production in HepG2 untreated cells (Ctr), HepG2 cells treated for 12 h with 1.5 mM FFAs 1, and HepG2 cells pre-treated with the extract (10–25–50 μg/mL) and exposed to FFAs 1. Results are expressed as percentage of intensity of fluorescence (I.F.)/mg protein vs. Ctr. Values are the mean ± S.D. of three independent experiments in triplicate. * Significant vs. untreated control cells: p < 0.001. # Significant vs. FFAs treated cells: p < 0.001.

