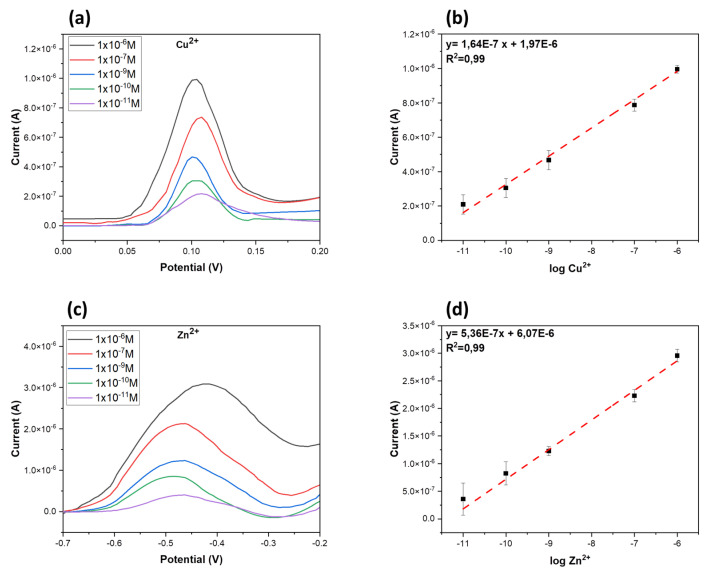
Figure 5.
Electrochemical characterization of ion sensors. Square wave voltammograms of Cu2+ at different concentrations (1 × 10⁻¹¹, 1 × 10⁻¹⁰, 1 × 10⁻⁹, 1 × 10⁻⁷, 1 × 10⁻⁶ M) in PBS (a); plot of CuCl2 peak currents vs. log Cu2+ concentrations (b). Square wave voltammograms of Zn2+ at different concentrations (1 × 10⁻¹¹, 1 × 10⁻¹⁰, 1 × 10⁻⁹, 1 × 10⁻⁷, 1 × 10⁻⁶ M) in PBS (c); plot of ZnCl2 peak currents vs. log Zn2+ concentrations (d).

