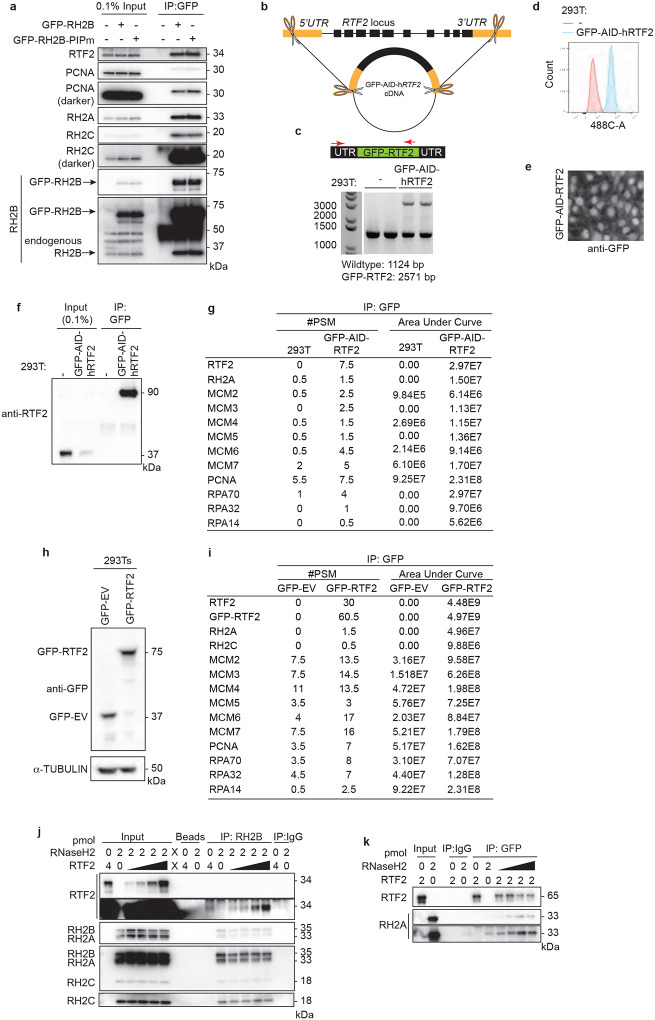
Extended Data Figure 6. RTF2 interacts with RNase H2 and components of the replisome.
a, Representative immunoblots following GFP immunoprecipitation of exogenously-expressed GFP-RNASEH2B-WT or GFP-RNASEH2B-PIP mutant from HEK293T cells. b, Schematic of CRISPR-Cas9 targeting to generate a tagged RTF2 construct expressed from the endogenous RTF2 locus. A plasmid carrying a GFP-AID-hRTF2 cDNA flanked by homology arms to the 5’UTR and 3’UTRs (orange boxes) of RTF2 was targeted to the endogenous locus of Rtf2 in HEK293T cells and subsequently cloned. This line will be referred to as endogenous GFP-AID-RTF2 HEK293Ts. c, Genotyping analysis of wild type and endogenous GFP-AID-RTF2 HEK293Ts. Schematic represents genotyping primers that were used to amplify the endogenously tagged locus. Forward primer recognizes RTF2 promoter region upstream to the GFP-AID-hRTF2 insert and reverse primer recognizes an RTF2 exonic region. The primer pair amplifies a wild type RTF2 allele of 1124 bp and the GFP-tagged allele of 2571 bp. d, Flow cytometry analysis of wild type and endogenous GFP-AID-RTF2 HEK293Ts. e, Representative images of immunofluorescence analysis of endogenous GFP-AID-RTF2 HEK293Ts. Cells were fixed and stained with anti-GFP antibodies. f, Representative immunoprecipitation with GFP antibodies from wild type and endogenous GFP-AID-RTF2 HEK293Ts. Immunoblotted with RTF2 antibody. The GFP-AID-hRTF2 protein is predicted to be 90.5 kDa. g, GFP was immunoprecipitated with GFP antibodies from wild type and endogenously targeted GFP-AID-RTF2 HEK293Ts in a-e. Average peptide spectral matches (#PSM) and area under the curve (AUC) from LC-MS for given proteins averaged across two biological replicates. h, Representative immunoprecipitation with GFP from HEK293Ts retrovirally expressing GFP-Empty Vector (GFP-EV) or GFP-human-RTF2 (GFP-RTF2). The GFP-hRTF2 construct is predicted to be 63.8 kDa. i, GFP was immunoprecipitated from the chromatin fraction of cell lysates with GFP nanobodies isolated from cells in g. Average #PSM and AUC from LC-MS for given proteins averaged across two biological replicates j, Representative immunoblot from immunoprecipitation of recombinant RNase H2 complex and RTF2 expressed in E. coli. Protein amount (pmol) are indicated above each lane; range of RTF2 is 0.5, 1, 2, 4 pmol. The blot corresponds to immunoblot shown in Figure 2f. k, Representative immunoblot from biochemical immunoprecipitation of recombinant GFP-tagged RTF2 and RNase H2 complex expressed in E. coli. Protein amount (pmol) indicated above each lane; range of RTF2 is 0.5, 1, 2, 4 pmol. Experiments were conducted at least two times in biological replicates with consistent results for e,g,i,j,k,l.

