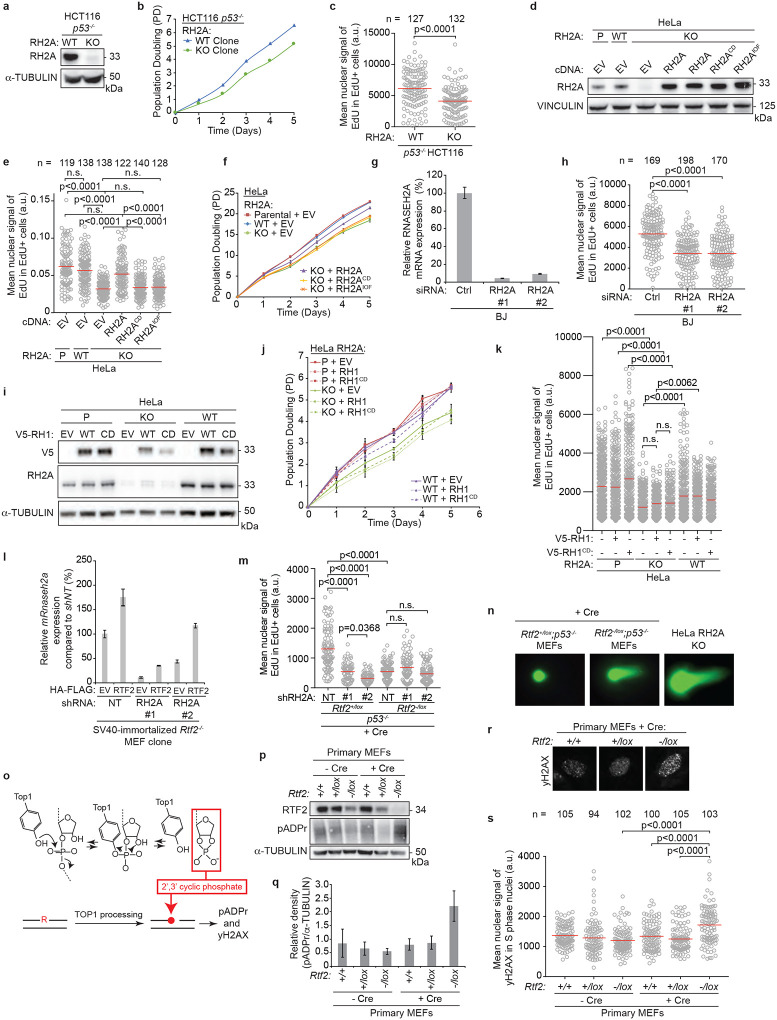
Extended Data Figure 7. RNase H2-deficient cells phenocopy growth and replication phenotypes of RTF2 deficiency.
a, Representative immunoblot showing loss of RNASEH2A in CRISPR-edited RNASEH2A KO HCT116 p53−/− cells. α-tubulin represents loading control. b, Growth curves of indicated cells. c, Quantification of representative experiment of mean signal of EdU in EdU-positive cells in indicated cells. d, Representative immunoblot showing complementation of wildtype, catalytic dead (RNASEH2AD34A;D169A), or isolation of function (RNASEH2AP40D;Y210A) RNASEH2A in CRISPR-edited RNASEH2A KO HeLa cells. Vinculin represents loading control. e, Quantification of representative experiment of mean signal of EdU in EdU-positive cells in indicated cells. f, Growth curves of indicated cells. g, Representative RT-qPCR analysis of relative human RNASEH2A transcript levels in BJ cells. Expression is normalized to β-actin expression. h, Mean nuclear signal of EdU in EdU-positive BJ cells treated with indicated siRNAs. i, Representative immunoblot showing expression of empty vector (EV), wildtype V5-RNASEH1, or catalytic dead V5-RNASEH1D210N in CRISPR-edited RNASEH2A KO or HeLa cells. α-tubulin represents loading control. j, Growth curves of indicated cells. k, Quantification of representative experiment of mean signal of EdU in EdU-positive cells in indicated cells. l, Representative RT-qPCR analysis of mouse Rnaseh2 expression in SV40-immortalized Rtf2−/− MEF clones expressing empty vector (EV) or HA-FLAG-mRTF2 (RTF2) transduced with indicated shRNAs. Rnaseh2 expression is normalized to β-actin. m, Quantification of representative experiment of mean signal of EdU in EdU-positive cells in indicated cells. n, Representative images of neutral comet assay post RNase HII-digestion with olive tail moment quantified in Fig. 2i. o, Schematic of TOP1-mediated ribonucleotide processing in the absence of RNase H2. p, Representative immunoblot of whole cell lysates in primary MEFs 72 hrs after infection with Hit & Run Cre showing poly-ADP-ribosylation. q, Average densitometry plots from three biological replicates as in o. r, Representative immunofluorescent images of γH2AX staining in primary MEFs after infection with Hit & Run Cre. s, Quantification of representative experiment of mean nuclear signal of γH2AX from r. Experiments were conducted at least three times in biological replicates with consistent results for a,c,d,e,g,h,i,k,l,m,n,p,r,s. Experiment were conducted three times in biological replicates with technical triplicates for b,f,j. Error bars represent standard deviation. Each dot represents one cell for c,e,h,k,m,s. Mean for each sample shown with red line for c,e,h,k,m,s. Cells were pulsed with EdU for 1 hr prior to fixation for c,e,h,k,m,s. Experiments were blinded prior to analysis for c,h. Significance evaluated by Kruskal-Wallis ANOVA with a Dunn’s post-test. RH2A = RNASEH2A, P = Parental, WT = wildtype, EV = empty vector, RH2ACD = catalytic dead RNASEH2AD34A/D169A, RH2AIOF = isolation of function RNASEH2AP40D/Y210A, RH1 = RNASEH1, CD = catalytic dead RNASEH1D210N, Ctrl = Control, NT = Non-targeting.

