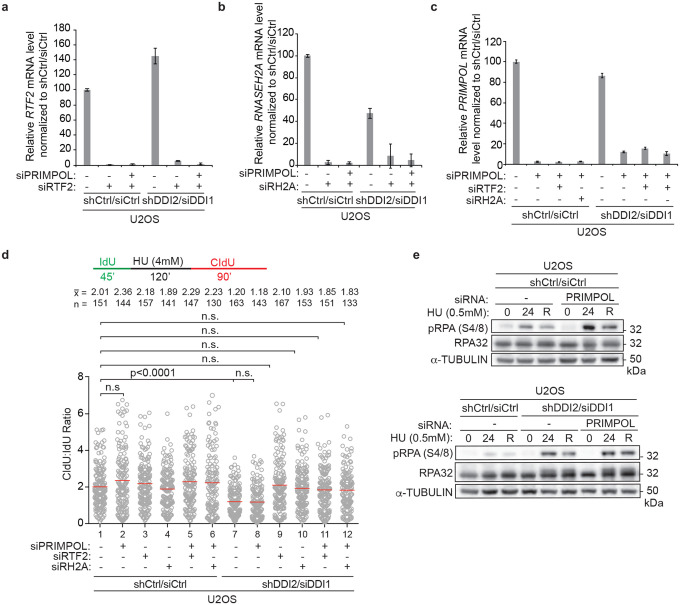
Extended Data Figure 9. PRIMPOL deficiency induces p-RPA S4/8 signal, but not a restart efficiency defect in response to replication stress.
a-c, Representative RT-qPCR analysis of relative human RNASEH2A, RTF2, or PRIMPOL transcript levels in indicated U2OS cells. Expression is normalized to GAPDH. d, Top: Labeling schematic. Bottom: Ratio of CldU:IdU tract lengths in indicated U2OS cells. e, Representative immunoblot in indicated U2OS cells treated with HU (0 = untreated, 24 = 24 hr treatment, R = 24 hr treatment followed by 8 hr release). α-tubulin represents loading control. Experiments were conducted at least three times in biological replicates with consistent results for a,b,c,d,e. Error bars represent standard deviation. Experiments were blinded prior to analysis for a,b,c,d,e. Mean is shown with red line for d. Average CldU:IdU ratios are listed above each sample for d. Outliers removed with ROUT (1%) for d. Significance evaluated by Kruskal-Wallis ANOVA with a Dunn’s post-test. RH2A= RNASEH2A, Ctrl = Control.

