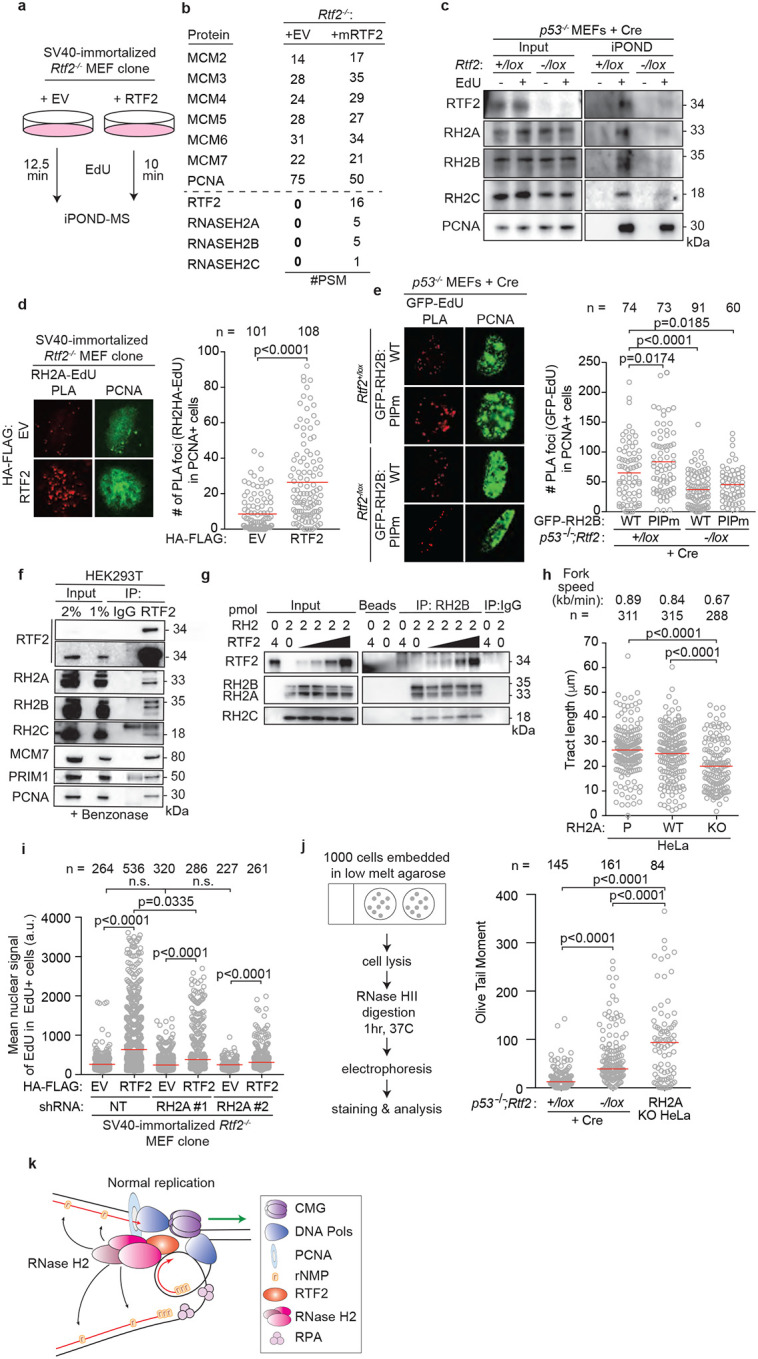
Figure 2. RTF2 recruits RNase H2 to the replication fork to facilitate normal replication and removal of genomic ribonucleotides.

a, Schematic of the iPOND set-up in SV40-immortlized immortalized Rtf2−/− MEFs expressing HA-FLAG empty vector (EV) or RTF2 cDNA. EdU pulses were normalized to replication tract lengths. Nascent DNA was purified using streptavidin beads against biotin-conjugated EdU. b, Peptide Spectral Match (#PSM) values for indicated proteins from experiment in a. c, Representative iPOND immunoblot from p53−/− MEFs at 72 hrs after Cre. d, Left: Representative images of RNASEH2A-EdU nascent proximity ligation assay (nPLA) co-stained with PCNA in SV40-immortalized Rtf2−/− MEFs expressing HA-FLAG EV or RTF2 cDNA. Right: Quantification of RNASEH2A-EdU foci in PCNA-positive cells. e, Left: Representative images from GFP-EdU nPLA co-stained with PCNA in p53−/− MEFs expressing GFP-tagged wildtype (WT) or PIP box mutant (PIPm) RNASEH2B at 72 hrs after Cre. Right: Quantification of GFP (RNASEH2B)-EdU foci in PCNA-positive cells. Note that endogenous RNase H2 is present in these cells. f, Representative immunoblots following immunoprecipitation of RTF2 from HEK293T cells. g, Representative immunoblot from immunoprecipitation of recombinant RNase H2 complex and RTF2 expressed in E. coli. Protein amount (pmol) indicated above each lane; range of RTF2 is 0.5, 1, 2, 4 pmol. Images for input and pulldown of RTF2 are separate exposures of the same blot. h, Quantification of representative experiment of replication tract lengths in CRISPR-edited RNASEH2A knockout (KO) or wildtype (WT) HeLa cells. i, Quantification of mean nuclear signal of EdU in EdU-positive SV40-immortalized MEFs, combined from 4 biological replicates. j, Left: Schematic of neutral comet assay post RNase HII-digestion. Right: Quantification of olive tail moment in p53−/− MEFs (72 hrs after Cre), combined from 4 biological replicates. RNASEH2A KO HeLa cells serve as positive control. k, Model of RTF2’s function to maintain RNase H2 levels at the replisome during normal replication. Experiments were conducted at least three times in biological replicates with consistent results for c,d,f,g,h,i. Experiment shown in e were conducted twice, in two biological replicates. Mean is shown with red line for d,e,h.i,j. Experiments were blinded prior to analysis for g and h. Average fork speeds are listed above each sample for g. Outliers removed with ROUT (1%) for g. Significance was evaluated by Kruskal-Wallis ANOVA with a Dunn’s post-test. P = Parental, RH2A= RNASEH2A, RH2B= RNASEH2B, RH2C= RNASEH2C, RH2 = RNASEH2 complex, Ctrl = Control.
