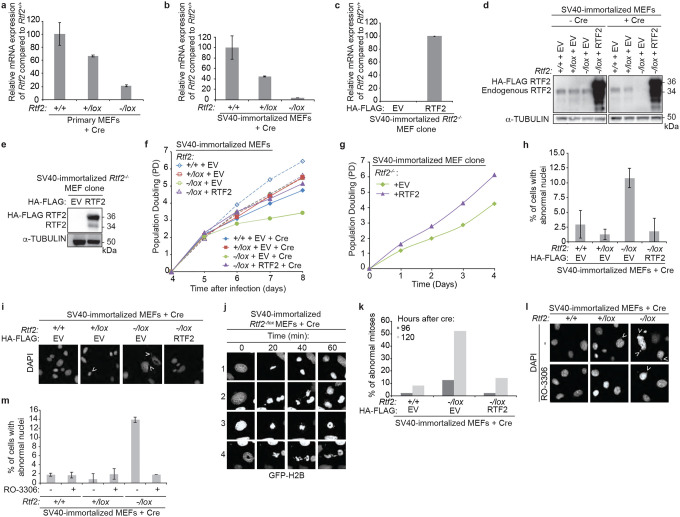
Extended Data Figure 2. Phenotypes of RTF2-deficient SV40-immortalized MEFs and clones are consistent with phenotypes observed in primary MEFs.
a,b,c, Representative RT-qPCR of relative Rtf2 mRNA transcript levels of cDNA prepared from primary MEFs (a) or SV40-immortalized (b) MEFs transduced with Hit & Run Cre recombinase retrovirus 96 hrs before harvest, or from an SV40-immortalized MEF Rtf2−/− clone expressing empty vector (EV) or RTF2 cDNA (c)44. Expression was normalized to β-actin expression. d, Representative immunoblot of whole cell lysates for RTF2 deletion in Rtf2−/lox SV40-immortalized MEFs expressing empty vector (EV) or HA-FLAG-mRTF2 (RTF2) cDNA constructs transduced with pWZL Cre-hygro retrovirus 120 hrs before harvest. α-tubulin represents loading control. e, Representative immunoblot of whole cell lysates in SV40-immortalized RTF2-deficient sub-cloned MEF lines expressing empty vector (EV) or HA-FLAG-mRTF2 (RTF2) cDNA constructs. α-tubulin represents loading control. f, g, Representative growth curves of MEFs 72 hrs after transduction with Hit & Run pMMP Cre (f) or of SV40-immortalized RTF2-deficient sub-cloned MEF lines expressing empty vector (EV) or HA-FLAG-mRTF2 (RTF2) cDNA constructs (g)44. h, Quantification of percentage of cells with abnormal nuclei based on DAPI staining from (i). i, Representative images of DAPI staining from indicated SV40-immortalized MEFs expressing empty vector (EV) or HA-FLAG-mRTF2 (RTF2) cDNA constructs and transduced with pWZL Cre-hygro retrovirus 120 hrs before imaging. Arrows indicate abnormal nuclei. j, Representative images of GFP-H2B staining in live Rtf2−/− SV40-immortalized MEFs expressing empty vector (EV) and transduced with pWZL Cre-hygro retrovirus 120 hrs prior to analysis undergoing mitosis. In row 1, a cell enters mitosis and undergoes a normal, efficient division. In rows 2–4, cells fail to complete successful mitosis, resulting in lagging chromosomes. k, Quantification of abnormal mitoses from live-cell imaging of Rtf2−/− SV40-immortalized MEFs expressing GFP-H2B and either empty vector (EV) or HA-FLAG-mRTF2 (RTF2) cDNA constructs and transduced with pWZL Cre-hygro retrovirus as in (j). l, Representative images of DAPI-stained nuclei from SV40-immortalized MEFs transduced with pWZL Cre-hygro retrovirus for 120 hrs and then treated with CDK1 inhibitor (RO-3306) for an additional 24 hrs to prevent mitosis. Cells fixed and imaged 144 hrs after Cre retroviral transduction. Arrows indicate abnormal nuclei. m, Quantification of abnormal DAPI-stained nuclei in images shown in (l). Experiments were conducted at least three times in biological replicates with consistent results for d,e,f,g,h,i. Averages from two biological replicates plotted in m. Error bars represent standard deviation. Significance was evaluated by Kruskal-Wallis ANOVA with a Dunn’s post-test.

