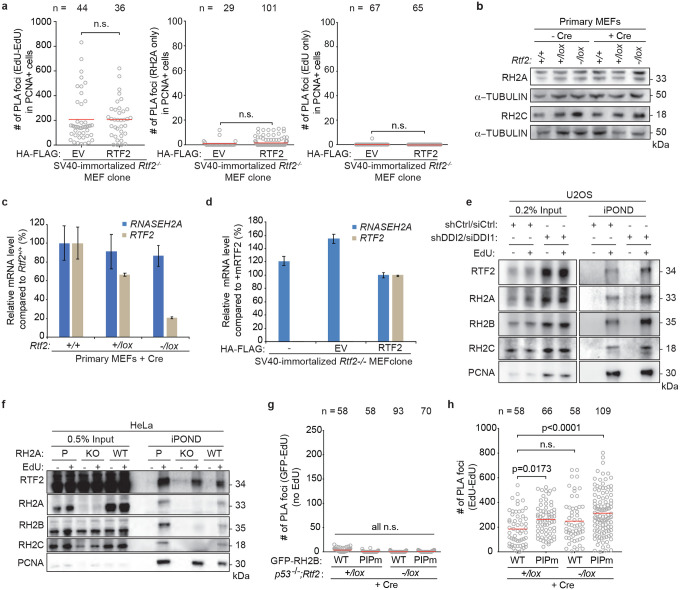
Extended Data Figure 5. RTF2 deficiency results in loss of RNase H2 from the replication fork.
a, Quantification of EdU-EdU PLA foci and single antibody (RNASEH2A and EdU) controls for nPLA in Fig. 2d. b, Representative immunoblot of whole cell lysates showing RNASEH2A and RNASEH2C levels in primary MEFs transduced with Hit & Run Cre recombinase retrovirus 72 hrs before harvest. c,d, RT-qPCR analysis of relative mouse Rnaseh2a and Rtf2 transcript levels in primary MEFs transduced with Hit & Run pMMP Cre retrovirus 72 hrs before harvest or in SV40-LT immortalized RTF2-deficient sub-cloned MEF lines expressing HA-FLAG empty vector (EV) or mRTF2 (RTF2) cDNA constructs, respectively44. Expression is normalized to β-actin. e, Representative iPOND immunoblot in DDI-depleted U2OS cells. Proteins purified using streptavidin beads recognizing nascent DNA were detected by western blot. DDI depletion increases levels of RTF2 and RNase H2 on nascent chromatin. f, Representative iPOND immunoblot in CRISPR-edited RNASEH2A KO or WT HeLa cells. Proteins purified using streptavidin beads recognizing nascent DNA were detected by western blot. RNase H2 loss does not diminish recruitment of RTF2 to nascent chromatin. g, Quantification of GFP (RNASEH2B)-EdU PLA foci in untreated cells (no EdU) for nPLA in Fig. 2e. h, Quantification of EdU-EdU PLA foci for nPLA in Fig. 2e. Experiments were conducted at least three times in biological replicates with consistent results for a,b,e,f. Error bars represent standard deviation. Mean is indicated with a red line for a,g. Experiment conducted twice in biological replicates with consistent results for g. Significance evaluated by Kruskal-Wallis ANOVA with a Dunn’s post-test. RH2A = RNASEH2A, P = Parental, KO = CRISPR-mediated RH2A knockout, EV = empty vector, RH2B = RNASEH2B, RH2C = RNASEH2C.

