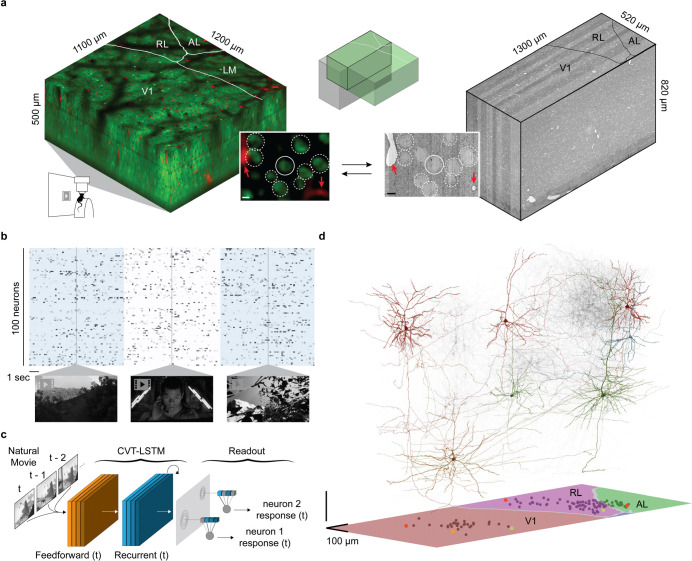
Figure 1. Overview of MICrONS Dataset.
a, Depiction of functionally-characterized volumes (left; GCaMP6s in green, vascular label in red) and EM (right; gray). Visual areas: primary visual cortex (V1), anterolateral (AL), lateromedial (LM) and rostrolateral (RL).The overlap of the functional 2P (green) and structural EM (gray) volumes from which somas were recruited is depicted in the top inset. The bottom inset shows an example of matching structural features in the 2P and EM volumes, including a soma constellation (dotted white circles) and unique local vasculature (red arrowheads), used to build confidence in the manually assigned 2P-EM cell match (central white circle). All MICrONS data are from a single animal. Scale bars = 5μm. b, Deconvolved calcium traces from 100 imaged neurons. Alternating blue/white column overlay represents the duration of serial video trials, with sample frames of natural videos depicted below. Parametric stimuli (not pictured) were also shown for a shorter duration than natural videos. c, Schematic of the digital twin deep recurrent architecture. During training, movie frames (left) are input into a shared convolutional deep recurrent core (orange and blue layers, CVT=convolutional vision transformer, LSTM=long short-term memory) resulting in a learned representation of local spatiotemporal stimulus features. Each neuron is associated with a location (spatial component in the visual field (gray layer) to read out feature activations (shaded blue vectors), and the dot product with the neuron-specific learned feature weights (shaded lines, feature component) results in the predicted mean neural activation for that time point. d, Depiction of 148 manually proofread mesh reconstructions (gray), including representative samples from Layer 2/3 (red), Layer 4 (blue), Layer 5 (green), and Layer 6 (gold). Bottom panel: presynaptic soma locations relative to visual area boundaries.

