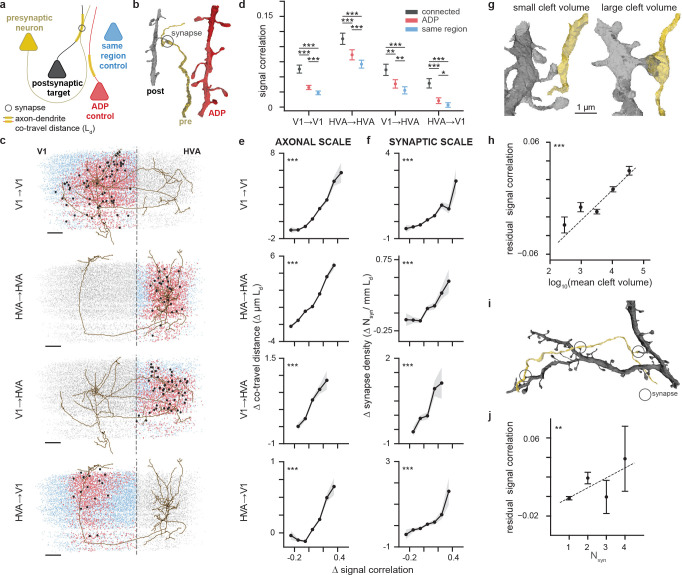
Figure 2. Neurons with higher signal correlation are more likely to form synapses.
a, Schematic illustrating inclusion criteria for anatomical controls. For each proofread presynaptic neuron (yellow), control neurons for its true postsynaptic partners (black) are drawn either from unconnected neurons with non-zero axon-dendrite co-travel distance (Axonal-Dendritic Proximity (“ADP”), red), or unconnected neurons with zero axon-dendrite co-travel distance located in the same cortical region (blue). The axon-dendrite co-travel distance (, yellow highlight on dendrites) is quantified as the total skeletal length of dendrite within 5 μm from any point on the presynaptic axon. A synapse is indicated with a gray circle. b, Representative meshes demonstrating a true presynaptic (“pre”, yellow axon) to postsynaptic (“post”, black dendrite) pair and an axonal-dendritic proximity control (“ADP”, red dendrite). c, Presynaptic neuron axons plotted in EM cortical space for the four projection types (V1→V1, HVA→HVA, V1→HVA, HVA→V1) along with soma centroids of connected partners (black dots), ADP control neurons (red dots), same area control neurons (blue dots) and all other functionally matched neurons that are not used as controls (gray dots). The same presynaptic neuron is plotted for both the V1→V1 and V1→HVA group, and another neuron is used for both the HVA→HVA and HVA→V1 groups to demonstrate that a single presynaptic neuron can be represented in multiple projection types. Dashed line represents the boundary between V1 and HVA. Scale bar: 100μm d, Mean signal correlation is different (mean ± sem, paired t-test) between synaptically-connected partners (black), ADP controls (red), and same region controls (blue). This relationship was observed for within-area (V1→V1, HVA→HVA), feedforward (V1→HVA), and feedback (HVA→V1) connectivity. For details, see Supplemental Tab. 2 e, Axon-dendrite co-travel distance () increases in a graded fashion with signal correlation. and signal correlation are the deviations from the mean for each presynaptic neuron. For reference, the mean for each projection type is: V1→V1, 9.03μm; HVA→HVA, 9.83μm; V1→HVA, 4.17μm; HVA→V1, 1.53μm. For details of the analysis, see Supplemental Tab. 3, 5 The shaded regions are bootstrap-based standard deviations. f As in e, but with synapse density (). Synapse density increases in a graded fashion with signal correlation, for within-area (V1→V1, HVA→HVA), feedforward (V1→ HVA), and feedback (HVA→V1) connectivity. For reference, the mean for each projection type is: V1→V1, 1.12 synapses / ; HVA→HVA, 0.83 synapses / ; V1→HVA, 1.55 synapses / ; HVA→V1, 1.26 synapses / . For details of the analysis, see Supplemental Tab. 4, 6 g, Representative meshes demonstrating synapses with small cleft volume (896 voxels, left) and large cleft volume (41716 voxels, right). h, Synapse size (log10 cleft volume in voxels) is positively correlated with signal correlation (p-values are from linear regression, residual signal correlation is obtained after regressing out the baseline effects on signal correlation due to differences in ). i, Representative meshes demonstrating a multisynaptic presynaptic (yellow) to postsynaptic (black) pair. j, Signal correlations increase with number of synapses (p-values are from linear regression, residual signal correlation is obtained after regressing out the baseline effects on signal correlation due to differences in ). (For all panels, * = p-value < 0.05, ** = p-value < 0.01, *** = p-value < 0.001, multiple comparison correction by BH procedure)

