
Figure 4. Like-to-like effects are widespread but vary across brain areas, cortical layers, and tuning similarity metrics.
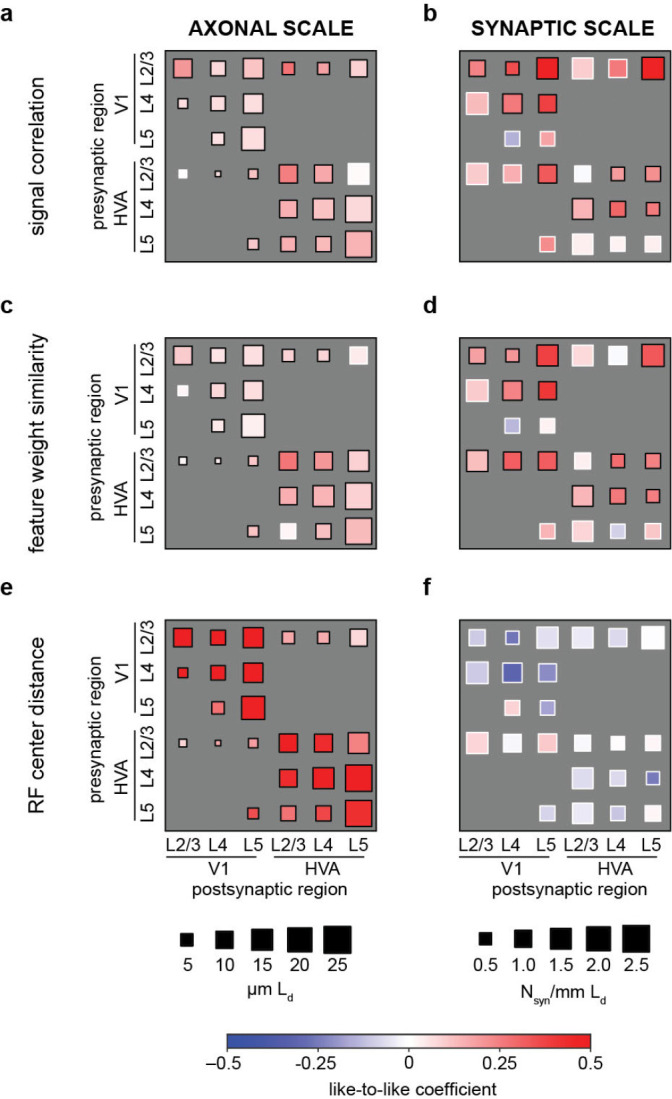
a-f, Degree of like-to-like broken down by area and layer membership measured at axonal (a, c, e) and synaptic scales (b, d, f). Colorbar: like-to-like coefficients, red is more like-to-like. For axonal scale, box size represents axon-dendrite co-travel distance (). For synaptic scale, box size represents synapse density (). Like-to-like coefficients are the coefficients of GLMMs fitted to predict axon-dendrite co-travel distance or synapse density with the corresponding functional similarity. (black border = significant at p-value < 0.05, white border = p-value > 0.05, by Wald test after BH correction for multiple comparisons, for details see Supplemental Tab. 26, 25, 28, 27, 30, 29).