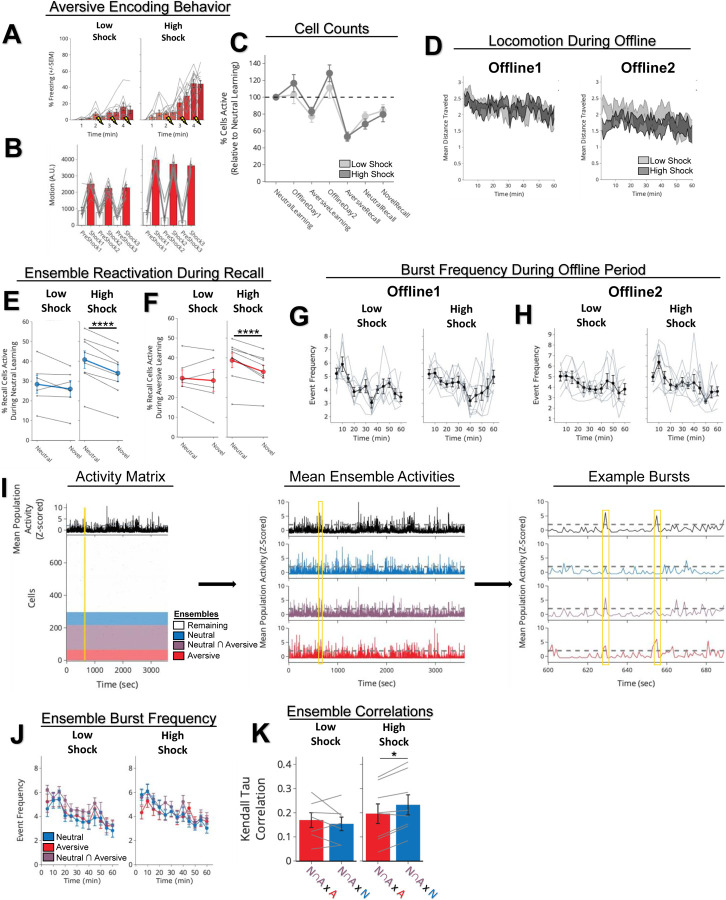
Extended Figure 4. Low vs High Shock calcium imaging supplementary analyses.
A) Mice acquired within-session freezing during Aversive encoding. Mice that received high shocks (1.5mA) displayed more freezing than mice that received low shocks (0.25mA) (Low Shock, N = 10 mice; High Shock, N = 12 mice).
B) Mice responded robustly to each foot shock. High shock mice responded more strongly to each shock than low mice did (Low Shock, N = 10 mice; High Shock, N = 12 mice).
C) Relative to the first calcium imaging recording, mice showed comparable fractions of observed cells across the remaining sessions (Low Shock, N = 8 mice; High Shock, N = 10 mice).
D) Locomotion across the 1hr offline period after Neutral encoding (Offline1) and after Aversive encoding (Offline2) in Low and High Shock mice. Mice showed decreased locomotion across the offline period on both days. Low Shock mice did not locomote differently from High Shock mice during either offline period (Low Shock, N = 10 mice; High Shock, N = 12 mice).
E) In High Shock mice, Neutral recall cells were composed of more Neutral encoding cells being reactivated, compared to Novel recall cells. In Low Shock mice, Neutral recall cells and Novel recall cells were composed of similar fractions of Neutral encoding cells being reactivated. Significant interaction between Context (Neutral vs Novel) and Amplitude (Low vs High Shock) (F1,12 = 6.81, p = 0.022) (Low Shock, N = 6 mice; High Shock, N = 8 mice). Post-hoc tests, Low Shock (t5 = 1.34, p = 0.24), High Shock (t7 = 10.22, p = 0.000037).
F) In High Shock mice, Neutral recall cells were composed of more Aversive encoding cells being reactivated, compared to Novel recall cells. In Low Shock mice, Neutral recall cells and Novel recall cells were composed of similar fractions of Aversive encoding cells being reactivated. Significant interaction between Context (Neutral vs Novel) and Amplitude (Low vs High Shock) (F1,12 = 4.75, p = 0.0499) (Low Shock, N = 6 mice; High Shock, N = 8 mice). Post-hoc tests, Low Shock (t5 = 0.59, p = 0.58), High Shock (t7 = 5.46, p = 0.0019).
G) During Offline1, burst event frequency gradually decreased across the hour (F11,143 = 4.43, p = 1.0e-5). No difference across shock amplitudes (F11,13 = 0.31, p = 0.587) (Low Shock, N = 7 mice; High Shock, N = 8 mice). Significant interaction between Time and Amplitude (F11,143 = 1.87, p = 0.047). Follow-up repeated measures ANOVAs showed that both Low and High Shock groups showed a significant decrease in event rate across time (Low Shock: F11,66 = 4.13, p = 0.0001; High Shock: (F11,77 = 2.43, p = 0.01).
H) During Offline2, burst event frequency decreased across time (F11,143 = 6.69, p = 0.000054). No difference across shock amplitudes (F1,13 = 0.0056, p = 0.94) (Low Shock, N = 7 mice; High Shock, N = 8 mice).
I) Example process of identifying ensemble co-participations during bursts. Data in this panel are down-sampled from 30Hz to 1Hz for visualization purposes. On the left, the bottom matrix represents the neuronal activities for all neurons recorded across the offline period, color-coded by ensemble (see Ensembles legend). The top black trace represents the z-scored mean population activity across the hour. The yellow line represents a time slice of representative bursts (expanded on the right). In the middle, the whole population mean population activity is shown again, with the mean population activity of the Neutral, Neutral ∩ Aversive, and Aversive ensembles shown below. From these population activities, the time periods above threshold for the whole population were considered whole population bursts, and within those, we measured how frequently the other ensembles participated in these bursts. On the right, we zoom into two example whole population bursts in yellow. In the first one, at 629 sec into the recording, the Neutral ∩ Aversive and Aversive ensembles participated, and in the second one, at 655 sec, only the Aversive ensemble participated.
J) During Offline2, bursts as defined by each ensemble (rather than by whole population) decreased across the hour, with comparable frequencies across ensembles and amplitudes (Low Shock, N = 7 mice; High Shock, N = 8 mice).
K) Time-lagged cross correlations between the N∩A ensemble and the Neutral and Aversive ensembles during the offline period. Each of the three ensembles (N∩A, Neutral, and Aversive) were binned into 120 sec bins. Each time bin of N∩A ensemble activity was cross-correlated with the corresponding time bin of Neutral ensemble and Aversive ensemble activity. Cross-correlations were computed with a maximum time lag of 5 frames (or, ~160ms). For each mouse, the correlations were averaged across all time bins to get an average cross-correlation between the N∩A ensemble and Neutral ensemble (i.e., N∩A x N) and the N∩A ensemble by Aversive ensemble (i.e., N∩A x A). There was a significant interaction between Ensemble Combination and Low vs High Shock group (F1,13 = 6.70, p = 0.02) (Low Shock, N = 7 mice; High Shock, N = 8 mice). Post-hoc tests revealed that in High Shock mice, N∩A x N correlations were higher than N∩A x A correlations (t7 = 3.97, p = 0.01) whereas they were no different in Low Shock mice (t6 = 0.83, p = 0.44).

