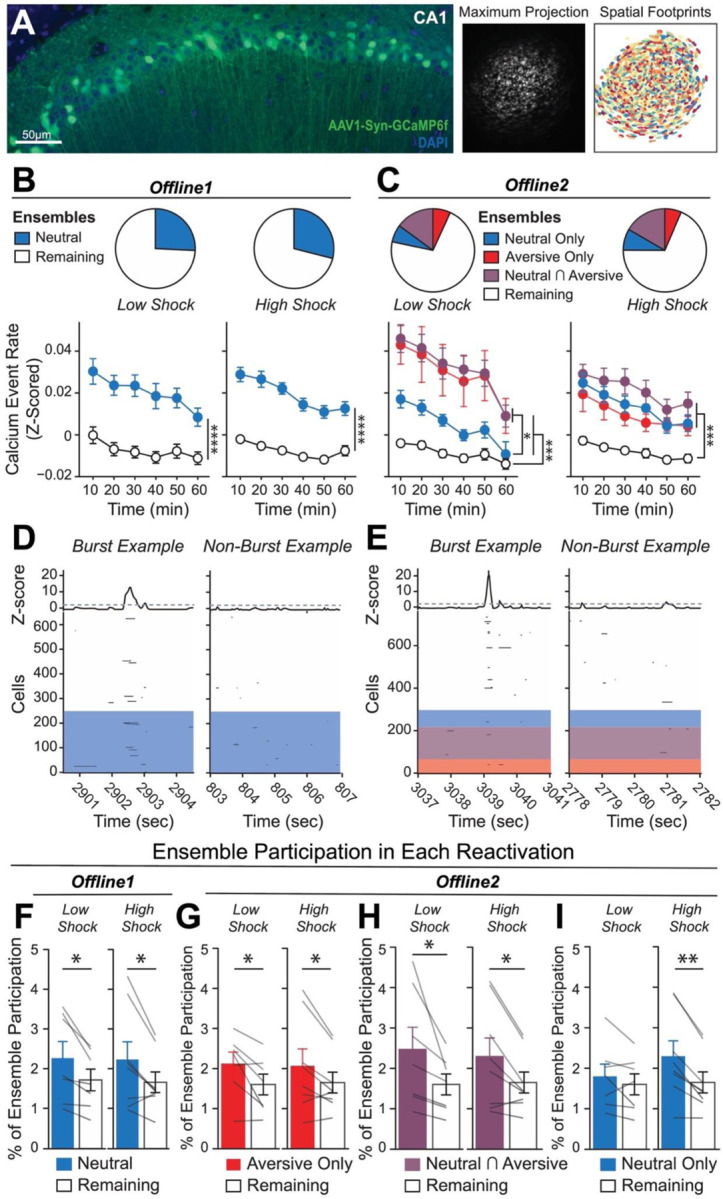
Figure 2. Strong aversive experience drives reactivation of a past neutral ensemble.

A) Representative histology (left) of GCaMP6f expression in hippocampal CA1, imaged with a confocal microscope. Green represents AAV1-Syn-GCaMP6f expression, while blue represents a cellular DAPI stain. Maximum intensity projection of an example mouse across one recording session, imaged with a Miniscope (middle), with the spatial footprints of all recorded cells during that session (right) randomly color-coded.
B) During Offline1 after Neutral encoding, cells that were active during Neutral encoding (Neutral ensemble) made up ~25–30% of the offline cell population (pie charts) (X2 = 0.122, df = 1, p = 0.73). The Neutral ensemble was more highly active than the Remaining ensemble during the offline period (line graphs; A.U.). There was a main effect of Ensemble (F1,159 = 59.19, p = 1.4e-12), no effect of Amplitude (F1,13 = 0.039, p = 0.85), and an effect of Time (F1,159 = 4.33, p = 0.039), and all interactions p > 0.05 (Low Shock, N = 7 mice; High Shock, N = 8 mice).
C) During Offline2 after Aversive encoding, similar proportions of previously active cells were reactivated across Low and High shock groups (pie charts) (X2 = 0.326, df = 3, p = 0.955). However, ensembles were differentially reactivated based upon the amplitude of the Aversive experience (Ensemble x Amplitude: F3,331 = 5.36, p = 0.0013) (line graphs; A.U.). In Low Shock mice, the Neutral, Aversive, and Neutral ∩ Aversive ensembles were more highly active than the Remaining ensemble (contrast, t18 = 4.22, p = 0.0005). Additionally, these ensembles were differentially active relative to one another (F2,12 = 4.03, p = 0.046). This was driven by the Neutral ensemble being less active. The Neutral ensemble was less active than the Aversive and Neutral ∩ Aversive ensembles (t12 = 2.83, p = 0.03) while the Aversive ensemble was no differently active than the Neutral ∩ Aversive ensemble (t12 = 0.19, p = 0.85). In High Shock mice, the Neutral, Aversive, and Neutral ∩ Aversive ensembles were all more highly active than the Remaining ensemble (t21 = 4.36, p = 0.0003), but these three ensembles were no differently active from each other (F2,14 = 1.52, p = 0.25) (Low Shock, N = 7 mice; High Shock, N = 8 mice).
D) During the offline periods, hippocampal activity displayed brief bursts of neural activity. To detect these bursts, we computed the z-scored mean activity of the entire recorded population and applied a threshold of z=2 and defined burst periods as all the timepoints above this threshold. The left raster represents an example burst period during Offline1, during which mean population activity briefly reached above threshold. Each row of the raster represents the activity of every recorded neuron, color-coded based on the ensemble it was a part of (blue represents Neutral ensemble and grey represents Remaining ensemble; see legend in Figure 2B). The top black trace represents the z-scored mean population activity. The right raster represents an example non-burst period.
E) Same as D but an example burst and non-burst period for Offline2. Each row of the raster again is color-coded based on the ensemble it was a part of (Aversive in red, Neutral ∩ Aversive in purple, Neutral in blue, and Remaining in grey; see legend in Figure 2C).
F) During Offline1 in both Low and High Shock groups, a larger fraction of the Neutral ensemble participated in bursts than the Remaining ensemble did (Ensemble: F1,13 = 16.33, p = 0.001; Amplitude: F1,13 = 0.009, p = 0.925; Ensemble x Amplitude: F1,13 = 0.0058, p = 0.940) (Low Shock, N = 7 mice; High Shock, N = 8 mice).
G) During Offline2 in both Low and High Shock groups, a larger fraction of the Aversive ensemble participated in bursts than the Remaining ensemble (Ensemble: F1,13 = 13.57, p = 0.0028; Amplitude: F1,13 = 0.000078, p = 0.99; Ensemble x Amplitude: F1,13 = 0.16, p = 0.69) (Low Shock, N = 7 mice; High Shock, N = 8 mice).
H) During Offline2 in both Low and High Shock groups, a larger fraction of the Neutral ∩ Aversive ensemble participated in bursts than the Remaining ensemble (Ensemble: F1,13 = 13.95, p = 0.0025; Amplitude: F1,13 = 0.014, p = 0.91; Ensemble x Amplitude: F1,13 = 0.31, p = 0.58) (Low Shock, N = 7 mice; High Shock, N = 8 mice).
I) During Offline2, Neutral and Remaining ensembles differentially participated in bursts in High and Low Shock groups (Ensemble x Amplitude: F1,13 = 5.186, p = 0.040). High Shock mice showed higher participation of the Neutral ensemble relative to Remaining ensemble (t7 = 4.88, p = 0.0036), whereas Low Shock mice showed no different participation between the two ensembles (t6 = 1.33, p = 0.23) (Low Shock, N = 7 mice; High Shock, N = 8 mice).
