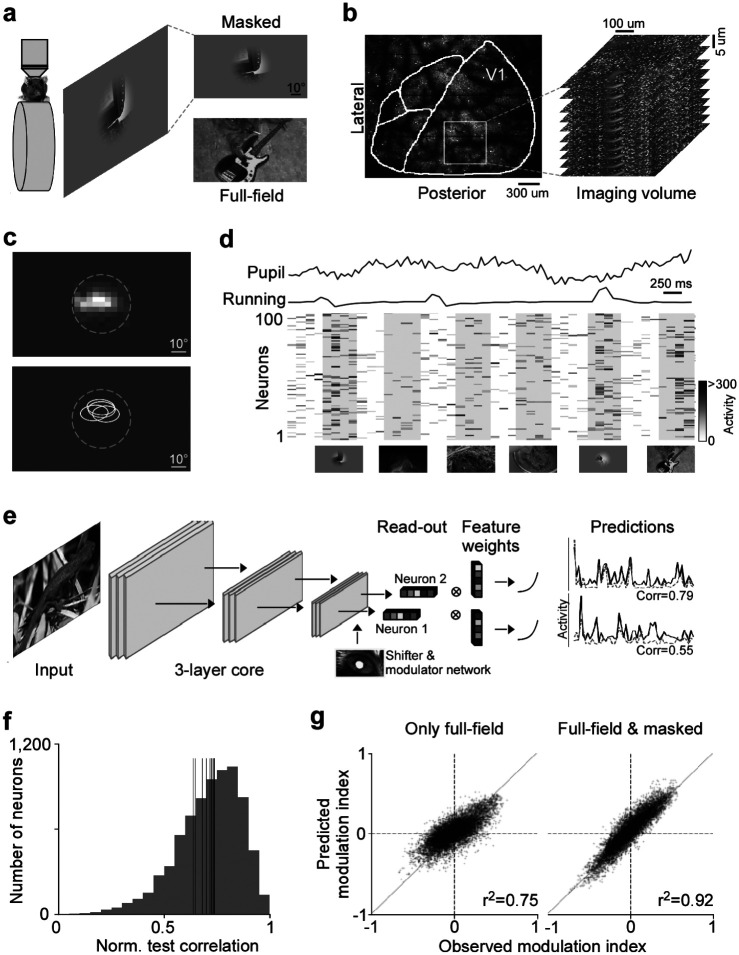
Fig. 1. Deep neural network approach captures center-surround modulation of visual responses in mouse primary visual cortex.
a, Schematic of experimental setup: Awake, head-fixed mice on a treadmill were presented with full-field and masked natural images from the ImageNet database, while recording the population calcium activity in V1 using two-photon imaging. b, Example recording field. GCaMP6s expression through cranial window, with the borders of different visual areas indicated in white. Area borders were identified based on the gradient in the retinotopy (Garrett et al., 2014). The recording site was chosen to be in the center of V1, mostly activated by the center region of the monitor. The right depicts a stack of imaging fields across V1 depths (10 fields, 5μstep in z, 630×630μ, 7.97 volumes/s). c, Top shows heat map of aggregated population RF of one experiment, obtained using a sparse noise stimulus. The dotted line indicates the aperture of masked natural images. The bottom shows RF contour plots of n=4 experiments and mice. d, Raster plot of neuronal responses of 100 example cells to natural images across 6 trials. Trial condition (full-field vs. masked) indicated below each trial. Each image was presented for 0.5s, indicated by the shaded blocks. e, Schematic of model architecture. The network consists of a convolutional core, a readout, a shifter network accounting for eye movements by predicting a gaze shift, and a modulator predicting a gain attributed to behavior state of the animal. Model performance was evaluated by comparing predicted responses to a held-out test set to observed responses. f, Distribution of normalized correlation between predicted and observed responses averaged over repeats (maximal predictable variability) for an example model trained on data from n=7,741 neurons and n=4,182 trials. Vertical lines indicate mean performance of other animals. g, Accuracy of model predictions of surround modulation for only full-field versus full-field and masked natural images. Each test image was presented in both full-field and masked, allowing us to compute a surround modulation index per image per neuron. The modulation indices across images were averaged per neuron. Left and right shows predicted vs. observed surround modulation indices for a model trained on only full-field images and full-field and masked images, respectively. The model trained on both full-field and cropped images predicted surround modulation significantly better than the model trained on only full-field images (p-value<0.001). The total number of training images was the same, and the data was collected from the same animal in the same session.

