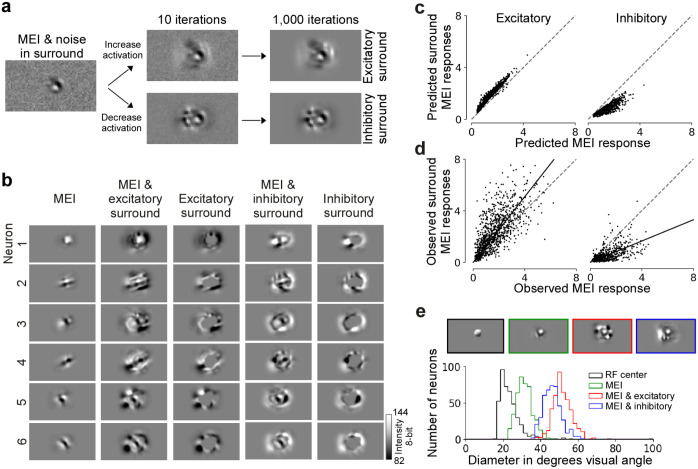
Fig. 2. Modeling approach accurately predicts non-parametric excitatory and inhibitory surround images of single neurons in mouse V1.
a, Schematic of the optimization of surround images. The initial image is Gaussian noise with the center replaced by the MEI. During optimization, the gradient only flows in the region where the inverse MEI mask is non-zero, leaving the center unchanged. We optimized for the most exciting or the most inhibiting image in the surround. After 1,000 iterations, we reached the final image of the excitatory or the inhibitory surround. b, Panel shows MEI, excitatory surround with MEI, the difference between the two, inhibitory surround with MEI, and the difference between the two for 5 example neurons. Since the gradient was set to zero during optimization for the area within the MEI mask, the center remained the same as the MEI. c, Model predicted responses to the excitatory (left) and inhibitory (right) surround images (y-axis), compared to the predicted responses to the MEIs (x-axis). Responses are depicted in arbitrary units, corresponding to the output of the model. d, Observed responses to the excitatory (left) and inhibitory (right) surround (y-axis), compared to the observed responses to the MEIs (x-axis). For each neuron, responses are normalized by the standard deviation of responses to all images. Across the population, the modulation was significant for both excitatory (p-value=1.15×10−75, Wilcoxon signed rank test) and inhibitory surround images (p-value=8.79×10−71). Across stimulus repetitions, 28.4% neurons responded significantly stronger to the excitatory surround image than to the MEI (n=6 animals, 960 cells, two-sided t-test, p-value<0.05) while 2.6% responded weaker. 55.1% neurons responded significantly weaker to the inhibitory surround image than to the MEI while 0.4% responded stronger (n=3 animals, 510 cells). Solid line indicates the regression line across the population, and dotted gray line indicates the diagonal. e, Diameters of RFs estimated using sparse noise, the MEIs, and the MEIs with excitatory and inhibitory surround. The mean of center RF (gray distribution) sizes across all neurons (n=4, 419 cells) is 23.4 degrees ± 0.34 (mean ± s.e.m.). The mean of the MEI (green distribution) size across all neurons (n=4, 434 cells) is 31.3 degrees ± 0.20. The size of the MEI is larger than the center RF. The sizes of both the excitatory (red distribution) and inhibitory (blue distribution) surround are much larger than the center RF, measuring 51.4 ± 0.23 and 46.1 ± 0.23 (mean ± s.e.m.) respectively (n=4, 434 cells).

