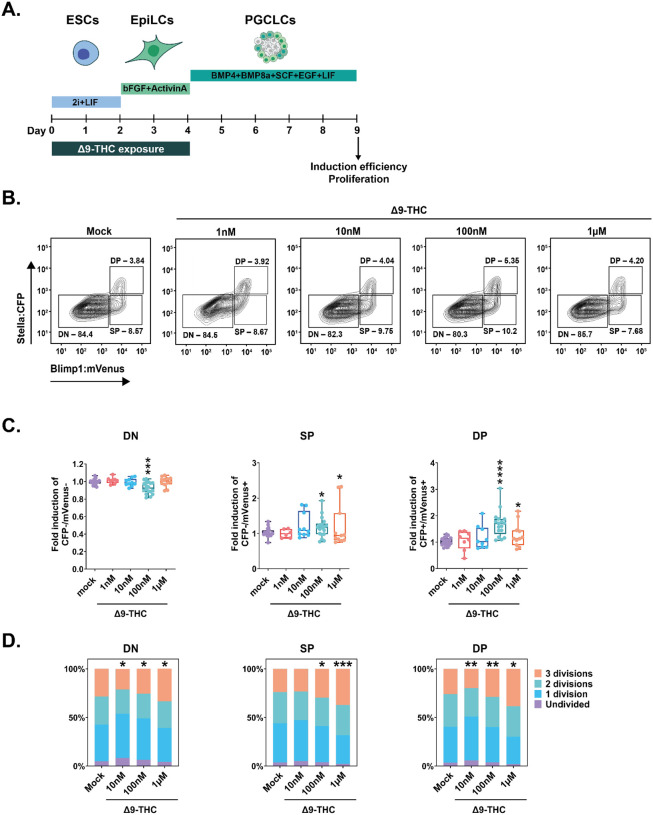
Figure 6: PGCLCs deriving from ESCs and EpiLCs exposed to 100nM of Δ9-THC proliferate.
(A) Diagram illustrating Δ9-THC exposure scheme and experimental strategy. (B) Representative flow contour plots showing distribution of live-gated events, gating strategy for Stella:CFP versus Blimp1:mVenus and percentages of cells in each subpopulations for ESCs and EpiLCs exposed to the different doses of Δ9-THC indicated. DN: double negative, SP: single positive, DP: double positive subpopulations. (C) The percentage of events in the gates associated to each subpopulation was normalized to the one measured in the mock-treated condition. Median and associated errors were plotted in whisker boxplots independently for each subpopulation. (D) Representative histograms showing CellTrace™ Yellow staining profile of cells arising from ESCs and EpiLCs exposed to the different doses of Δ9-THC indicated. The Y-axis represents the average percentage of cells in each category of subpopulations undividing (purple), undergoing 1 division (blue), 2 divisions (green) or 3 divisions (orange). One representative experiment out of three is represented. Statistical significance: *(p<0.05), **(p<0.01), ***(p<0.001), ****(p<0.0001).

