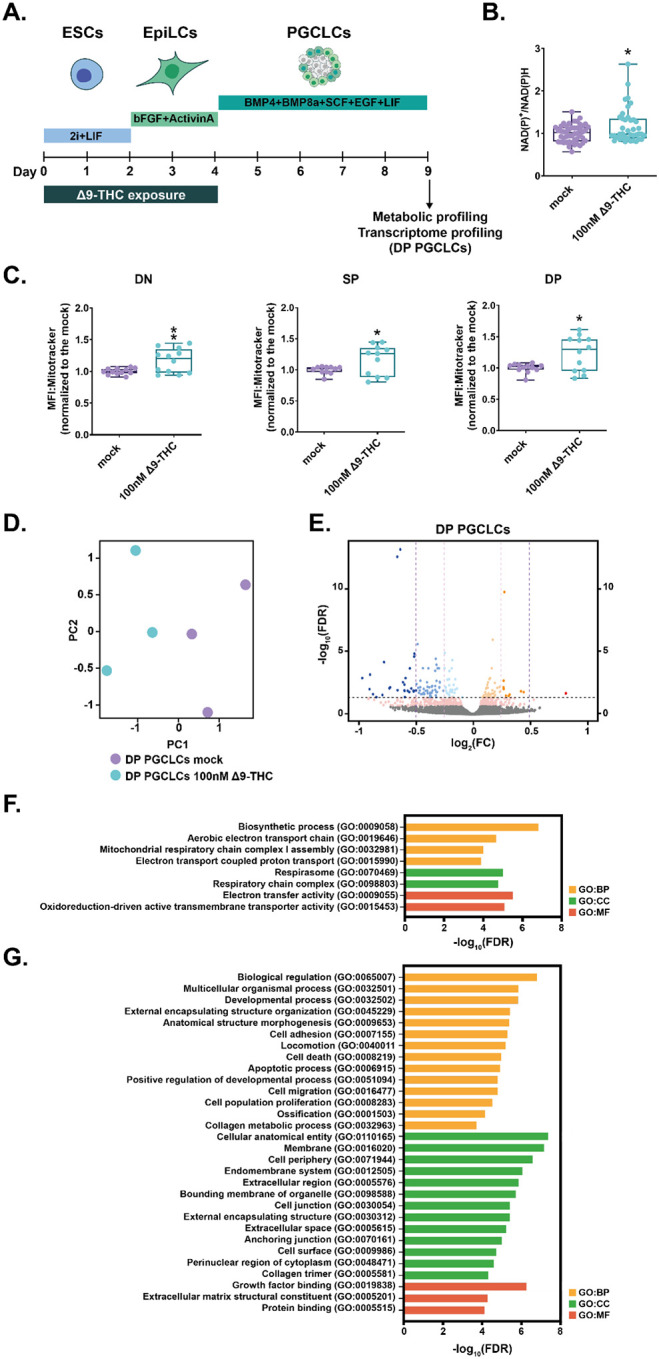
Figure 7: Δ9-THC exposure prior to specification increases mitochondrial respiration in PGCLCs.

(A) Diagram illustrating Δ9-THC exposure scheme and experimental strategy. (B) The NAD(P)+/NADPH ratio of embryoid bodies arising from ESCs and EpiLCs exposed to 100nM of Δ9-THC was normalized to the one measured in the mock-treated condition. Median and associated errors were plotted in whisker boxplot. (C) Mean fluorescence intensity (MFI) associated with the Mitotracker CMXRos stain in each subpopulation was normalized to the one measured in the mock-treated condition. Median and associated errors were plotted in whisker boxplots. (D) PCA of the transcriptomics profiling of DP PGCLCs deriving from ESCs and EpiLCs either mock-exposed or exposed to 100nM Δ9-THC. (E) Volcano plot in DP PGCLCs showing significance [expressed in log10(adjusted p-value or false-discovery rate, FDR)] versus fold-change [expressed in log2(fold-change, FC)]. Thresholds for significance and different enrichment ratios [|(log2(FC)|>0.25 or |log2(FC)|>0.5] are shown as dashed lines. Color code is as follows: log2(FC)>0.5 in red, log2(FC)>0.25 in orange, log2(FC)>0 in light orange, log2(FC)<0 in light blue, log2(FC)>−0.25 in blue, log2(FC)>0.5 in dark blue and p-value<0.01 in pink. (F and G) Gene ontology (GO) terms associated with up- and downregulated DEGs [|(log2(FC)|>0.25 and p<0.01)], respectively, as determined by g:Profiler55. Statistical significance: *(p<0.05), **(p<0.01).
