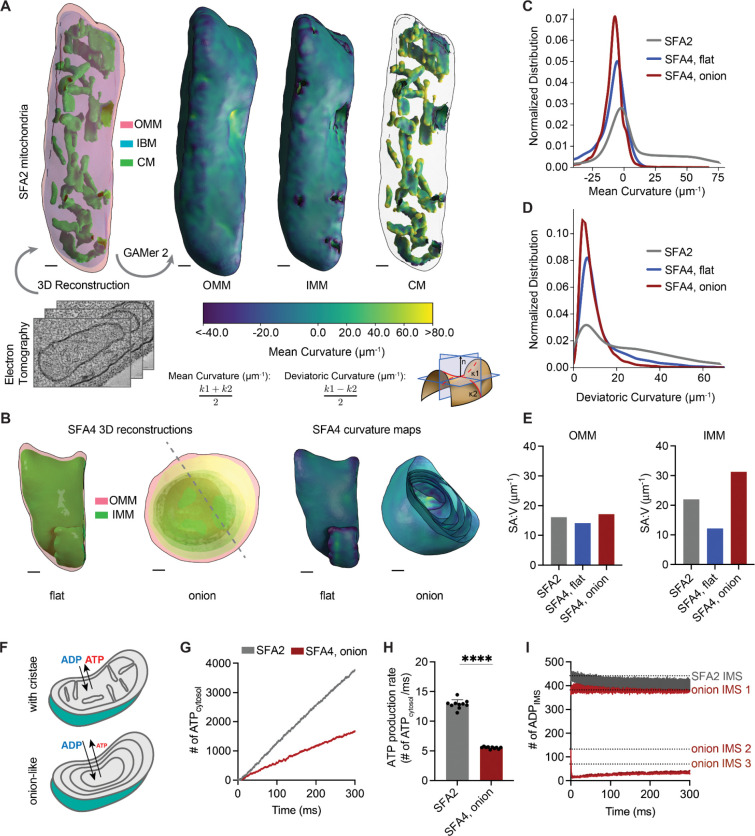
Figure 2:
PL saturation shifts the IMM to a regime of low membrane curvature, which reduces IMM surface area and modeled transport rates needed for ATP generation.
(A) 3D reconstruction of mitochondrial membrane topology and quantification of curvature using the GAMer 2 pipeline. Shown are electron tomograms of mitochondria from SFA2 cells, which show regular, tubular CM. CM are highlighted alongside the OMM and the inner boundary membrane (IBM) in the 3D reconstruction. (Right) Maps of mean curvature of OMM, IMM and CM computed using GAMer2. Scale bars, 50 nm.
(B) 3D reconstructions of SFA4 mitochondria showing flat (Δmgm1-like) and onion (Δatp20-like) abnormal morphologies. Also shown are the maps of mean curvature showing the IMM of these abnormal mitochondria, using the same color scale as in A. The onion-like IMM is sliced at an angle to illustrate the many layers; each layer is spherical in nature. Scale bars, 50 nm.
(C) Histograms of mean curvature distributions of inner membranes generated from SFA2 and SFA4 reconstructions, highlighting that high mean curvature areas in SFA2 IMM are lost in SFA4 cells.
(D) Histograms of deviatoric curvature distributions of inner membranes generated from SFA2 and SFA4 reconstructions, which are mechanical corollaries to curvature induced by ATP synthase dimerization, highlight that high deviatoric curvature areas in SFA2 IMM are lost in SFA4 cells.
(E) The IMMs of onion mitochondria show increased surface area:volume (SA:V) ratio compared to SFA2 while flat mitochondria show a decrease in the surface area:volume without major changes to the OMM.
(F) Schematic of ATP production in mitochondria containing normal CMs and those showing a multi-layer, online-like IMM, highlighting how multiple membrane layers could impede in trafficking of ADP and ATP.
(G) Modeled cytosolic ATP generation from mitochondria with a CM-containing morphology (taken from SFA2 tomogram) vs. an onion-like (taken from SFA4 tomogram) IMM. ATP generated in the cytosol in each condition is an average from 10 simulations. Details of the model equations and simulations are provided in the Supplementary Text.
(H) Comparison of cytosolic ATP generation rates derived from multiple Monte Carlo simulations shown in G. 10 simulations were run for each morphology. Error bars indicate SD; ****p<0.0001, unpaired two-tailed t-test.
(I) Modeled substrate depletion in onion-like mitochondria. In the CM-containing mitochondrion, the ADP level in the IMS remains constant at ~440 ADP throughout the 300 ms simulation. In the onion-like SFA4 mitochondrion, ADP remains constant only in the first IMS layer and is rapidly depleted in layers 2 and 3, indicating that the multi-layer structure could be limiting for ATP/ADP trafficking. Dotted lines represent initial values of ADP in each IMS layer.

