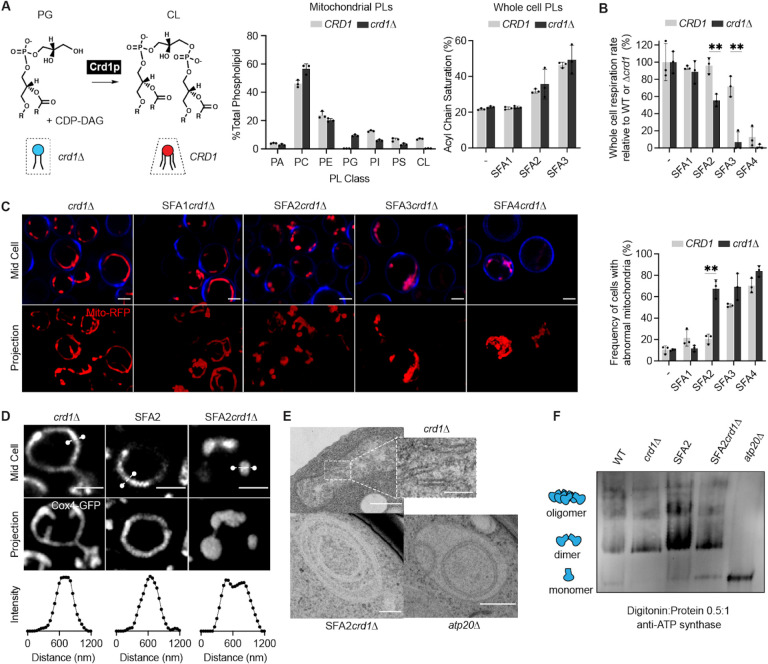
Figure 4:
Epistasis between PL saturation and CL synthesis in shaping mitochondrial morphology.
(A) Loss of Crd1p decreases mitochondrial CL content, but otherwise does not significantly affect the mitochondrial lipidome. (Left) Reaction schematic depicting cylindrical PG and CDP-DAG converted into conical CL by Crd1p. (Right) Head-group stoichiometry of lipidomes from isolated mitochondria from WT and crd1Δ cells and acyl chain saturation (% of acyl chains with a double bond) for CRD1 and crd1Δ cells across the SFA series. Error bars indicate SD from n=3 biological replicates.
(B) Loss of CL causes a loss of respiration in SFA2 cells. Whole cell respiration rates are shown for SFA strains, comparing CRD1 with crd1Δ cells. Respirometry was conducted in biological triplicates (n=3) by Clark electrode. Error bars indicate SD. **p<0.005 unpaired two-tailed t-test between SFA2 and SFA3 strains and their corresponding crd1Δ mutants.
(C) The morphological breakpoint shifts to SFA2 upon loss of CL. (Left) Representative Airyscan confocal micrographs of yeast expressing matrix-localized RFP (mts-RFP). Cells were stained cell wall-binding calcofluor white (blue) for clarity. Scale bars, 2 μm. (Right) Frequency of mitochondrial abnormality, N>50 cells were counted in n=3 independent cultures for each condition. Error bars indicate SD. **p=0.0011 unpaired two-tailed t-test between CRD1 and crd1Δ in the SFA2 background.
(D) SFA2crd1 cells show hollow mitochondria, imaged with Cox4-GFP. Scale bars, 2 μm. Line profile analysis (below) depicts fluorescent intensity across the indicated mitochondria.
(E) Thin section TEM micrographs of crd1Δ show IMM with cristae invaginations (see inset, scale bars 100 nm), while SFA2crd1Δ cells show an onion-like IMM similar to what has been observed in atp20Δ. Scale bars, 400 nm.
(F) SFA2crd1Δ retains ATP synthase dimerization. Shown are BN-PAGE western blots run from digitonin-solubilized isolated mitochondria of SFA strains and WT with and without CL, atp20Δ is the monomeric ATP synthase control.

