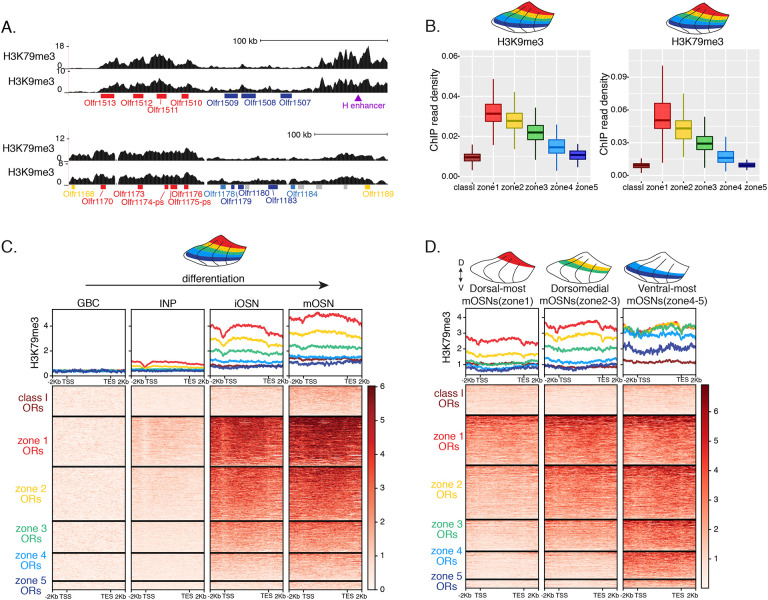
Figure 2: Heterochromatin deposition silences OR genes from lower zones.
(A) Signal tracks of H3K9me3 and H3K79me3 native ChIP-seq from the whole MOE show heterochromatin deposition over two representative OR gene clusters. These clusters were selected because they harbor OR genes with both dorsal (zone 1) and ventral (zone 5) identities. OR genes are colored according to their zonal identity: zone 1 ORs in red, zone 2 ORs in yellow, zone 5 ORs in blue and ORs with unknown zonal identity in gray. Purple triangle marks the “H” OR gene enhancer that is present within that OR gene cluster.
(B) H3K9me3 (left) and H3K79me3 (right) native ChIP-seq in the whole MOE. Box plots of read density over OR gene bodies, separated by their zonal identity, depict a pattern of deposition that is high on dorsal-most (zone 1) OR genes, progressively decreases with more ventral zonal OR identities, and is absent on class I ORs.
(C) H3K79me3 native ChIP seq in GBC, INP, iOSN and mOSN populations shows onset of H3K79me3 deposition as cells transition from INPs to iOSNs. Each row of the heatmaps shows coverage over an OR gene body (separated into categories by their zonal identity). (See also Supplementary Figure S2A for H3K9me3 heatmap).
(D) H3K79me3 native ChIP-seq in mOSNs from zonally dissected MOE. Colored schematics above each heatmap depict the zone of dissection. (See also Supplementary Figure S2B for H3K9me3 heatmap). (A-D) Pooled data from two biological replicates is shown for all ChIP experiments.

