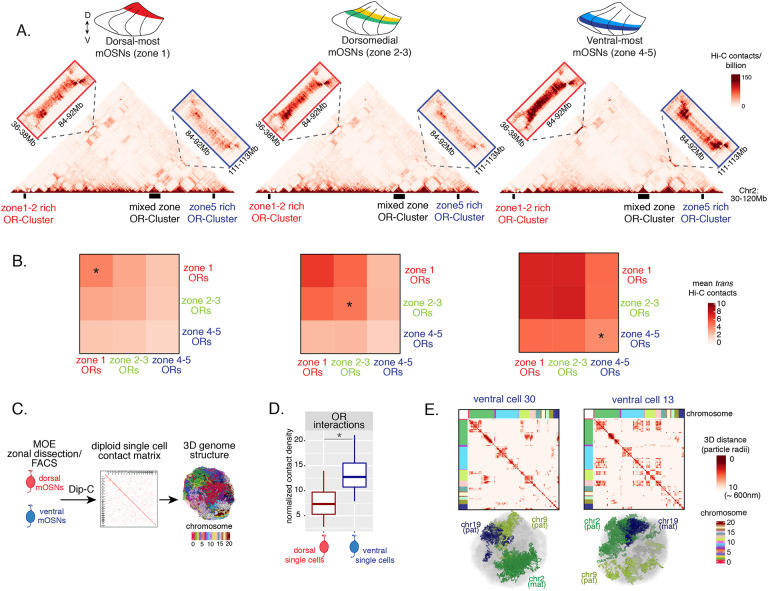
Figure 3: Zonal OR compartmentalization permits OR genes from more ventral zones to be recruited into the OR compartment.
(A) In situ Hi-C contact matrices of a 90Mb region of chromosome 2 that contains 3 large OR gene clusters, depicted with boxes under the contact matrices. Hi-C libraries were prepared from mOSNs FAC-sorted from dorsal-most (zone1) and ventral-most (zone 4–5) MOE microdissections, as well as a pure population of Olfr17 (a zone 2 OR) expressing dorsomedial mOSNs. For each zonal contact matrix, magnified views show long-range cis Hi-C contacts between the large OR gene cluster in the middle that contains ORs of every zonal identity with the OR cluster on the left that contains mostly zone 1–2 identity ORs (red box) and the OR cluster on the right that contains mostly zone 4–5 identity ORs (blue box). Cis contacts between OR genes increase from dorsal to ventral mOSNs, but the zone 4–5 identity OR cluster associates with the other ORs only in the ventral-most OSNs (as seen when comparing Hi-C contacts in the blue boxes).
(B) Heatmaps of average interchromosomal Hi-C contacts between OR genes annotated by their zonal identity at 50Kb resolution show increased trans contacts in mOSNs from more ventral zones. OR genes have a similar, intermediate frequency of contacts in the mOSN population where they are expressed, marked with an asterisk. Class I OR genes (which are also expressed in zone 1) make few interchromosomal interactions in all zones (data not shown) and were thus excluded from this analysis.
(C) Dip-C in mOSNs from dorsal and ventral dissected MOE was used to generate haplotype resolved single cell contact matrices and 3D genome structures, as previously described [40].
(D) Analysis of Dip-C contact densities of interchromosomal contacts between ORs genes confirms that ventral mOSNs have increased OR compartment interactions (Wilcoxon rank sum p-value = 9.164e-11).
(E) Single cell heatmaps of pairwise distances between OR genes generated from 3D genome structures in two ventral mOSNs show OR genes from different chromosomes intermingle in a different pattern in the two cells (top). For each cell, heatmaps are sorted by chromosome order and show all OR interactions within 10 particle radii (approximately ~600nm). Representative 3D structures show the different positioning of three chromosomes (chr19, chr9 and chr2) in the two cells, resulting in a different pattern of OR cluster contacts (bottom). See also Supplementary Figure S3 for heatmaps of Dip-C distances in each of the 48 dorsal and ventral mOSNs.

