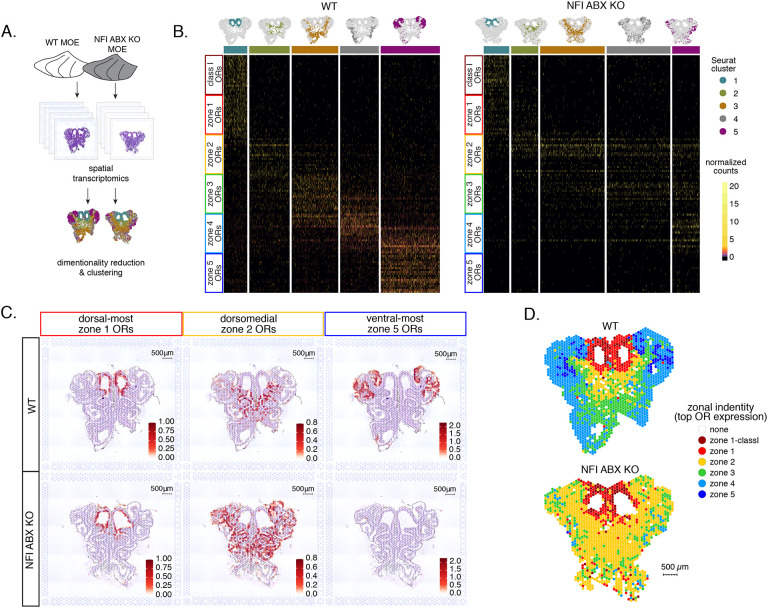
Figure 5: Spatial transcriptomics shows dorsalization and homogenization of the MOE upon NFI A, B, and X deletion.
(A) Schematic depicting our analysis pipeline: Spatial transcriptomics was performed on sections of wt control and NFI ABX cKO MOE. Dimensionality reduction was performed, and spatial spots were clustered based on normalized expression of OR genes.
(B) Heatmaps showing scaled, normalized expression levels of the top 20 highest expressed OR genes per zone in the control dataset. Unbiased neighborhood analysis and clustering grouped spatial spots into 5 clusters for both control and cKO MOE (depicted in distinct colors on the top of the heatmaps). Clustering of spatial spots in the control sample reproduces anatomical zones, as spots within each cluster express OR genes with the corresponding zonal identity (left heatmap). The same clusters were generated for NFI cKO sample (right heatmap). Although cluster 1 expresses exclusively zone 1 ORs, like in control MOEs, clusters 2–5 exhibit homogenous OR expression, with ventral expansion of zone 2/3 ORs, and reduced representation of zone 4/5 ORs.
(C) Average normalized per-spot expression of the 20 highest expressed OR genes from zone 1, zone 2, and zone 5 is overlaid against H&E histological image of control (top) and NFI cKO (bottom) MOE sections. Expression of zone 1 OR genes is confined to the same anatomical region for both control and NFI cKO sections. Zone 2 OR gene expression is spread to more ventral regions in the NFI cKO compared to control sections, while expression of zone 5 OR genes is almost completely absent in the NFI cKO sample.
(D) Spatial spots are colored according to their zonal assignment, which was determined based on the highest summed normalized expression of OR genes per zonal identity within that spot. Zonal spot assignment of the control sample visually reproduces known anatomical zones. In the NFI cKO sample, spots in the dorsal region have the highest expression of class I and zone 1 OR genes, similar to the control sample. However, in the rest of the NFI cKO MOE, most spots have a zone 2 OR identity. Spots assigned the identity ‘none’ did not contain any OR transcripts and were excluded from cluster analysis.

