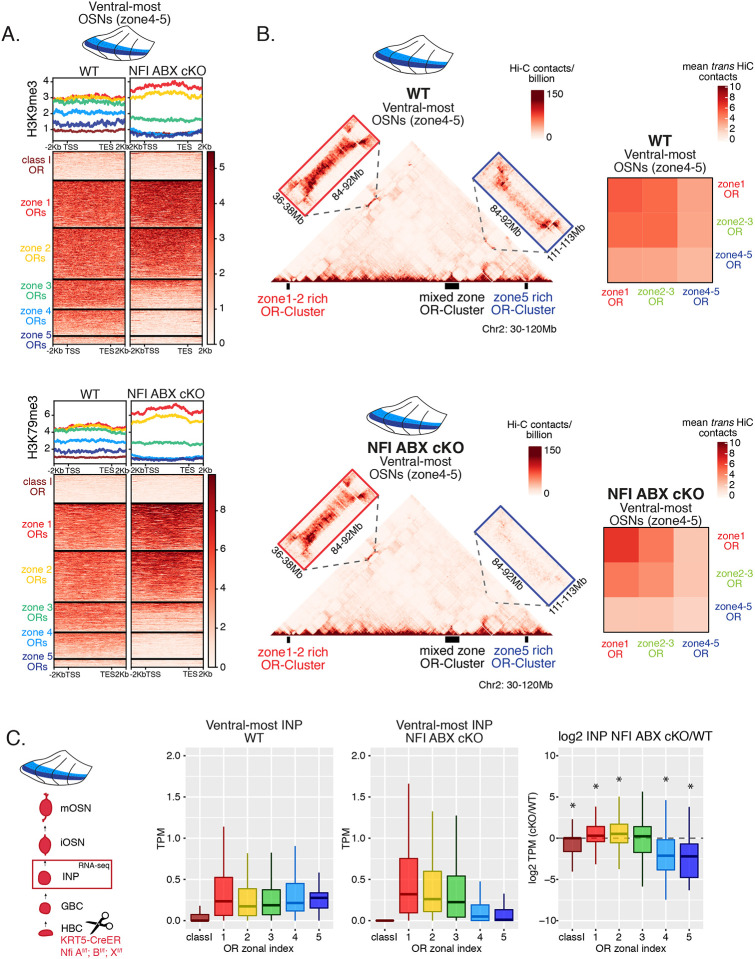
Figure 6: NFI A, B and X regulate chromatin state and OR compartment formation.
(A) Native ChIP-seq for H3K9me3 (top) and H3K79me3 (bottom) in NFI ABX knockout mOSNs from ventral MOE. Heatmaps show ChIP signal over OR gene bodies, scaled to 6kb with 2kb flanking on either side. There is a decrease of both histone marks on zone 3–5 identity OR genes in NFI ABX knockout compared to control. Triple NFI deletion was induced with the Krt5-CreER driver (before OSN differentiation).
(B) Hi-C in in NFI ABX knockout and control mOSNs from ventral MOE. Left: In situ Hi-C contact matrices of a 90Mb region of chromosome 2 from control (top) and NFI ABX triple knockout (bottom) ventral mOSNs, as described in Figure 3A. The contact matrix shows long-range cis interactions between 3 large OR gene clusters: one enriched for dorsal, zone 1–2, identity ORs (left), one containing ORs of every zonal identity (middle), and one enriched for ventral, zone 4–5, identity ORs. Note that long range cis contacts between the zone 4–5 identity enriched cluster and the mixed identity cluster dissipate in the triple NFI cKO (bottom, blue box), whereas the contacts of the mixed identity cluster with the zone 1–2 identity enriched cluster are preserved (bottom, red box). Right: Heatmaps of average interchromosomal Hi-C contacts between OR genes annotated by their zonal identity (as described in Figure 3B) in control (top) and triple NFI cKO (bottom) mOSNs from ventral MOE. Trans contacts between zone 4–5 ORs dissipate, whereas trans contacts between zone 2–3 ORs reach intermediate levels typically detected between OR genes with the “correct” zonal identity for a given MOE segment (see Figure 3).
(C) OR expression by zonal identity in INP cells isolated from ventral NFI ABX knockout and control MOE. Triple NFI deletion was induced with the Krt5-CreER driver (before OSN differentiation) and NFI ABX INP cells were isolated as described in Supplementary Figure S4. Log2 fold change of OR expression in NFI ABX vs control INP cells shows a significant decrease in expression of zone 4–5 ORs (right).

