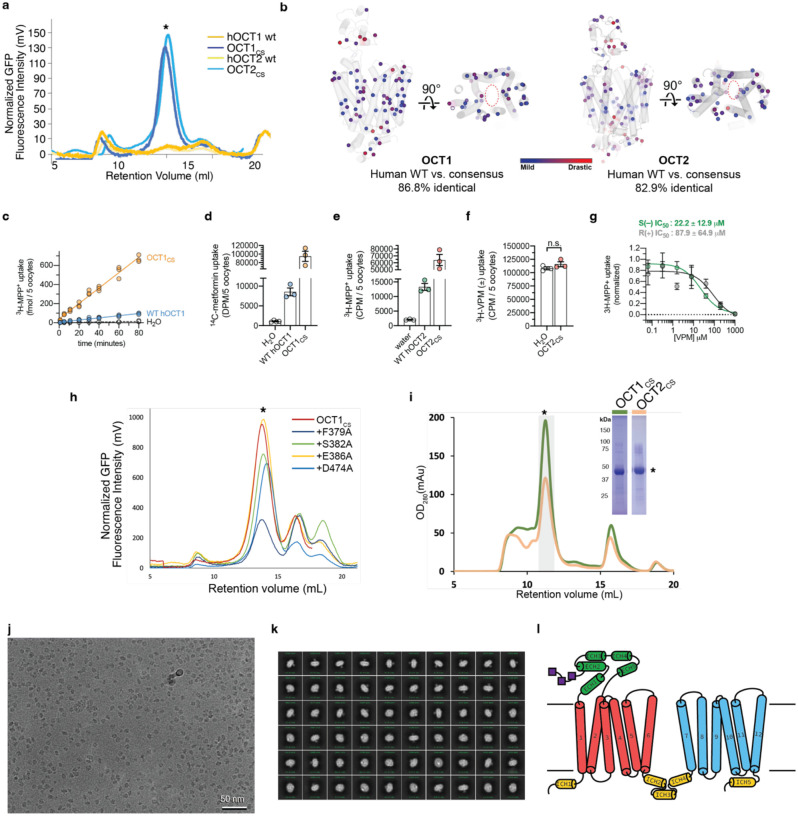
Extended Data Figure 1 |. Consensus mutagenesis, protein biochemistry, and cryo-EM analysis of OCT1CS.
a, FSEC traces showing strong monodisperse peak of OCT1CS-GFP, WT hOCT1-GFP, OCT1CS-GFP and WT hOCT2-GFP which exhibits no discernable peak corresponding to target protein (expression performed in HEK293T cells). b, Map of all residues in OCT1CS and OCT2CS that deviate from WT hOCT1. The residues are colored based on their conservation score from MAFFT alignment. Blue spheres indicate mildly changed, while red spheres indicate drastic changes. Only two residues differ from hOCT1 (Y36 and F446 in OCT1CS and C36 and I446 in hOCT1) in the central ligand binding cavity. c, Time-dependent accumulation of 10 nM [3H]-MPP+ in WT hOCT1 and OCT1CS expressing oocytes (n = 3 per timepoint). d, Raw uptake values for controls in the OCT1 [14C]-metformin uptake experiments, corresponding to Fig. 1e. e, Raw uptake values for controls in the OCT2 [3H]-MPP+ uptake experiments, corresponding to Fig. 1f. f, [3H]-verapamil (100 nM) does not accumulate in OCT2CS-injected oocytes over the course of 30 min (n =3, individual values and mean ± S.E.M), demonstrating it is not an OCT2CS substrate. g, Stereoselectivity of verapamil inhibition against OCT2CS mediated [3H]-MPP+ uptake (100 nM radiotracer, 30 minute uptake, n =3, mean ± S.E.M) h, FSEC traces showing expression of selected OCT1CS mutants in HEK293T cells. i, Representative size-exclusion chromatography trace (left) and SDS-PAGE (right) of purified OCT1CS and samples OCT1CS used for cryo-EM grid preparation. j, Representative micrograph of a OCT1CS sample. OCT2 CS behaves similarly under cryo-EM with OCT1 CS. k, Representative 2D classes from a OCT1CS dataset. l, Secondary structure topology of OCT1 and OCT2.

