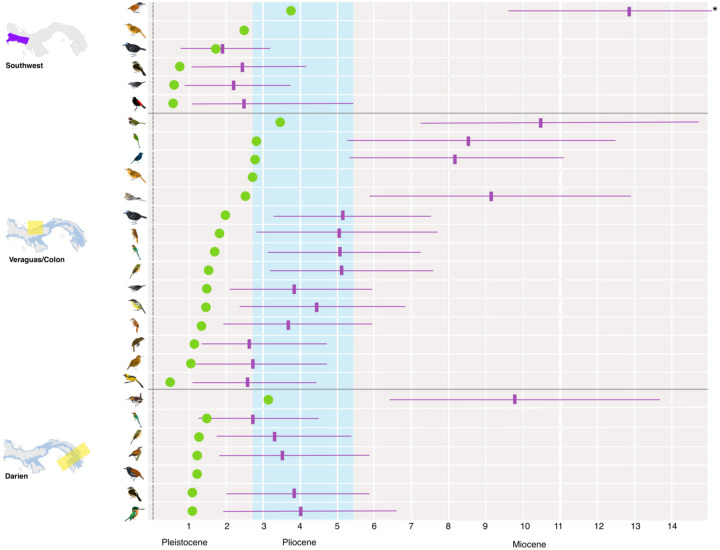
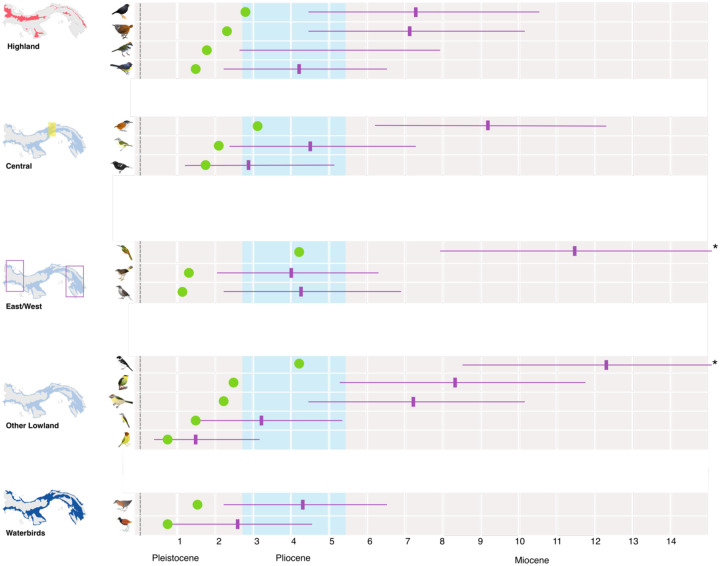
Figure 5:
Timing of mitochondrial splits for Panamanian birds in millions of years. Time was calculated from pairwise COI divergence (green) and in BEAST2 (purple, shown with median and 95% confidence intervals [CIs]). Splits are grouped by region as in Figure 3, with those taxa with multiple splits being shown for each. Some CIs are truncated due to space (indicated with asterisk); see Table 3 for full details.


