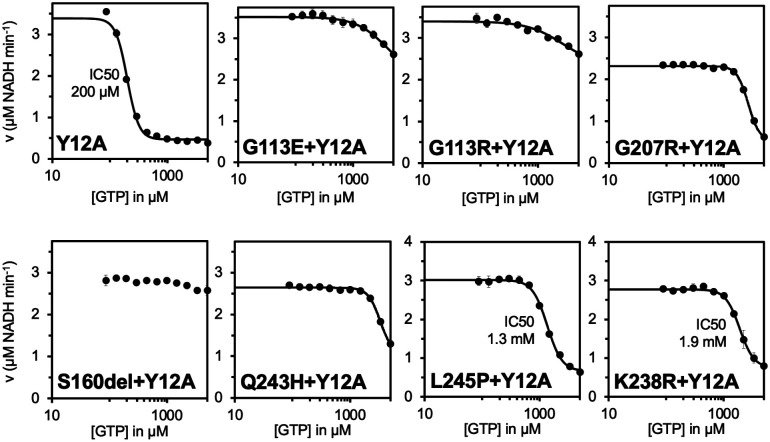
Fig. 5. Mutations also disrupt GTP inhibition of free octamers.
GTP inhibition curves of Y12A non-assembly mutant and Y12A/disease mutant double mutants of IMPDH2. Each data point represents the average initial rate of three reactions. Error bars represent standard deviation for n=3 technical replicates. Velocities were calculated from the change in absorbance at 340 nm. Reactions were initiated with 300 μM NAD+ and contained 1 μM enzyme, 1 mM ATP, 1 mM IMP, 1 mM MgCl2 and varying concentrations of GTP.

