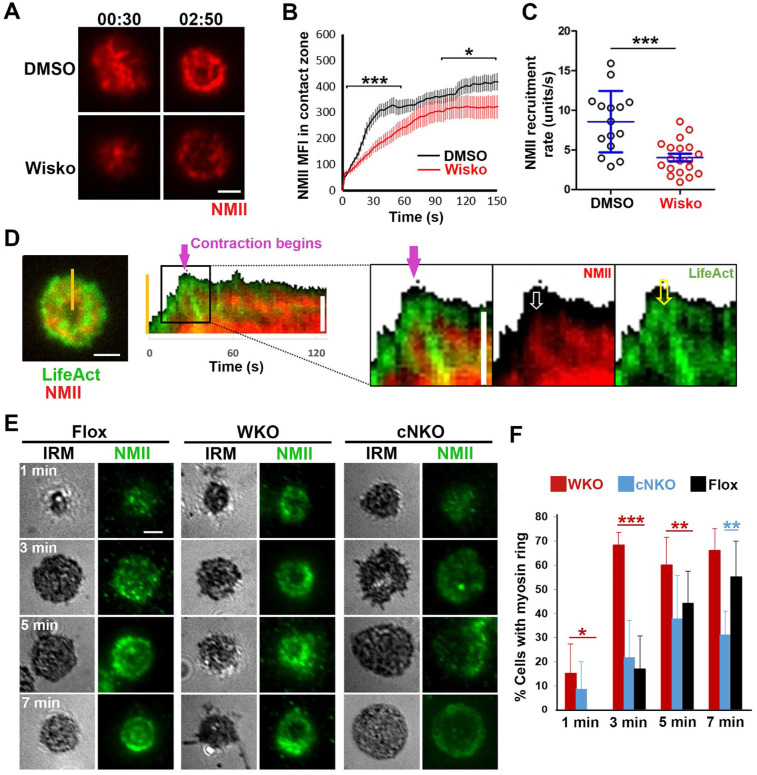
Figure 5. Inner F-actin foci, generated by N-WASP-activated Arp2/3, facilitate NMII recruitment and ring-like structure formation.
(A-C) B-cells from mice expressing the GFP fusion of non-muscle myosin IIA (GFP-NMIIA) transgene were treated with DMSO or Wisko (10 μM) 10 min before and during incubation with Fab’-PLB. The B-cell contact zones were imaged live using TIRF. Shown are representative TIRF images of DMSO- and Wisko-treated B-cells at 30 sec (during spreading) and 2 min 30 sec (after maximal spreading) post landing (A, Scale bars, 2 μm), the averaged GFP-NMIIA MFI (±SEM) (B), and the initial rates of increasing (±SEM) of GFP-NMIIA in the contact zone (the slope of the initial GFP-NMIIA MFI versus time curves of individual cells) (C). Data points represent individual cells from 3 independent experiments with ~6 cells per condition per experiment. * p <0.05, ***p<0.001, by Kolmogorov-Smirnov test (B) or non-parametric student’s t-test (C). (D) Primary B-cells from mice expressing both GFP-NMIIA and LifeAct-RFP transgenes were incubated with Fab’-PLB at 37°C and imaged live by TIRF. Shown are a representative TIRF image of a cell and a kymograph generated from time-lapse TIRF images at the yellow line. The purple arrow indicates the starting point of contraction, the white arrow GFP-NMIIA recruitment proximal to the spreading membrane, and the yellow arrow an F-actin (LifeAct-RFP) focus originating at the lamellipodia and moving away from the spreading membrane. (E, F) Primary B-cells from flox control, WKO, and cNKO mice were incubated with Fab’-PLB for indicated times. Cells were fixed, permeabilized, stained for NMII light chain, and imaged by IRM and TIRF. Shown are representative IRM and TIRF images (E) and percentages (±SD) of B-cells with the NMII ring-like structure in individual images (F), identified by visual inspection. The data were generated from 3 independent experiments with 5 images per condition per experiment. Scale bars, 2 μm. * p <0.05, ** p <0.01, *** p<0.001, by non-parametric student’s t-test.
Figure 5-Video 1. Wiskostatin treatment inhibits NMII ring-like structure formation.

