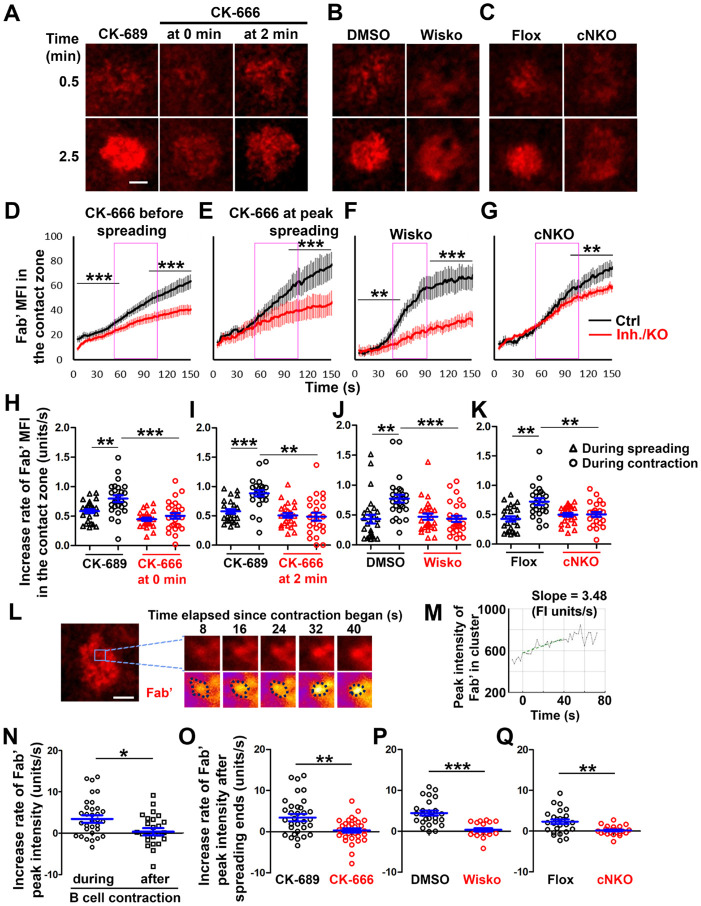
Figure 6. B-cell contraction increases the molecular density within BCR clusters.
Primary B-cells from WT mice were treated with CK-689 or CK-666 from the beginning of the incubation with AF546-Fab’-PLB (0 min) or at the maximal B-cell spreading (2 min) (A, D, E, H, I, N, O). WT B-cells were treated with DMSO or Wisko (10 μM) 10 min before and during the incubation with AF546-Fab’-PLB (B, F, J, P). B-cells from flox control and cNKO mice were incubated with AF546-Fab’-PLB (C, G, K, Q). The B-cell contact zones were imaged live by TIRF. (A-C) Representative time-lapse images at 30 sec (during B-cell spreading) and 2 min 30 sec (after maximal spreading) after cell landed. Scale bars, 2 μm. (D-G) The MFI of AF546-Fab’ in the contact zone was plotted over time. Purple rectangles indicate the contraction phase. (H-K) Rates of AF546-Fab’ MFI increases in the B-cell contact zone before and during contraction were determined by the slope of AF546-Fab’ MFI versus time plots. Data points represent individual cells and were generated from 3 independent experiments with 6–12 cells per experiment. * p <0.05, ** p <0.01, *** p<0.001, by Kolmogorov-Smirnov test (D-G) or paired student’s t-test (H-K). (L) A representative frame from a time-lapse of a CK-689-treated B-cell (left) shows AF546-Fab’ clusters 30 sec after contraction began, and enlarged time-lapse images (right) show a single AF546-Fab’ cluster over a 40-sec time window after contraction began. AF546 clusters were identified using the criteria: ≥250 nm in diameter, ≥1.1 fold of FI outside the B-cell contact zone, and trackable for ≥ 20 sec. Scale bars, 2 μm. (M) The peak FI of an AF546-Fab’ cluster was measured over time, and the increasing rate of AF546-Fab’ peak FI of this cluster was determined by the slope of the plot. (N-Q) The rates (±SEM) of increase in AF546-Fab’ peak FI in individual clusters were compared between during and after contraction (N), between B-cells treated with CK-689 and CK-666 from 0 min (O), between DMSO- and Wisko-treated B-cells (P), and between flox control and cNKO B-cells (Q) after B-cells reached maximal spreading. Data points represent individual cells, the averaged slopes of clusters detected in one B-cell, from 3 independent experiments with 6~12 cells per condition per experiment. *p <0.05, ** p <0.01, ***p<0.001, by non-parametric student’s t-test.
Figure supplement 1. Fab’-PLB, but not Tf-PLB, induces BCR clustering and phosphorylation.
Figure supplement 2. Tracking and analyzing AF546-Fab’ clusters in the B-cell contact zone.
Figure 6-Video 1. Inhibition of B-cell contraction reduces the molecular density within BCR clusters.

