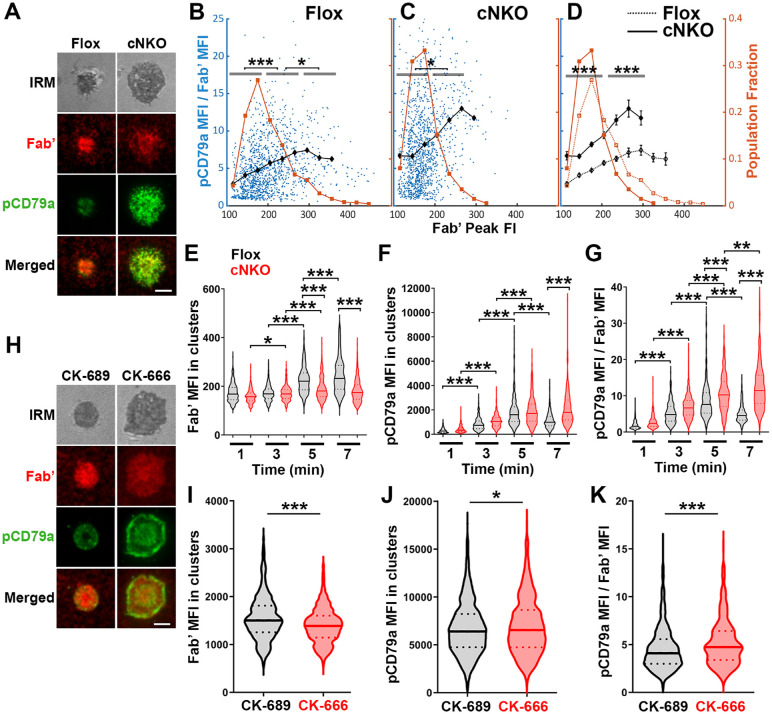
Figure 7. Increased molecular density in BCR clusters leads to reductions in BCR phosphorylation.
(A-G) Flox control and cNKO B-cells incubated with AF546-Fab’-PLB were fixed at 1, 3, 5, and 7 min, permeabilized, stained for phosphorylated CD79a (pCD79a, Tyr182), and imaged using TIRF and IRM. (A) Representative IRM and TIRF images of a flox control versus a cNKO B-cell at 7 min. Scale bars, 2 μm. (B-D) Ratios of pCD79a MFI relative to AF546-Fab’ MFI were plotted against AF546-Fab’ peak FI in individual AF546-Fab’ clusters in the contact zone of flox control (B), cNKO B-cells (C), or flox control and cNKO B-cells overlay (D). AF546-Fab’ clusters were identified as described in Figure 6 and Figure 6-figure supplement 2, from an equal number of cells at the 4 time points. Data points represent individual AF546-Fab’ clusters with an equal number of clusters from each time point. The black diamond symbols represent the average ratios of pCD79a MFI to Fab’ MFI in individual BCR-Fab’ clusters within the indicated Fab’ peak FI range. The brown square symbols represent the fraction of the AF546-Fab’ clusters out of the total, within the indicated Fab’ peak FI range. Data were generated from 3 independent experiments with ~20 cells and ≥125 clusters per condition per experiment. * p <0.05, *** p<0.001, by non-parametric student’s t-test. (E-G) The MFI (±SEM) of AF546-Fab’ (E) and pCD79a (F) and the MFI ratio (±SEM) of pCD79a relative to AF546-Fab’ (G) in individual AF546-Fab’ clusters at indicated times were compared between flox control and cNKO B-cells and between different times. (H-K) WT B-cells treated with CK-689 or CK-666 after 2 min-incubation with AF546-Fab’-PLB. (H) Representative IRM and TIRF images of a CK-689- versus a CK-666-treated B-cell at 7 min. Scale bars, 2 μm. (I-K) The MFI (±SEM) of AF546-Fab’ (I) and pCD79a (J) and the MFI ratio (±SEM) of pCD79a relative to AF546-Fab’ (K) in individual AF546-Fab’ clusters were compared between CK-689- and CK-666-treated B-cells after 7 min stimulation. Data points represent individual clusters. Horizontal solid lines in the violin plots represent the mean, while the dotted lines represent the quartiles of the distribution. Data were generated from 3 independent experiments with ~20 cells per condition per experiment. * p <0.05, *** p<0.001, by non-parametric student’s t-test. The p-values in D were corrected using the Benjamini-Hochberg/Yekutieli method for false discovery rate control.

