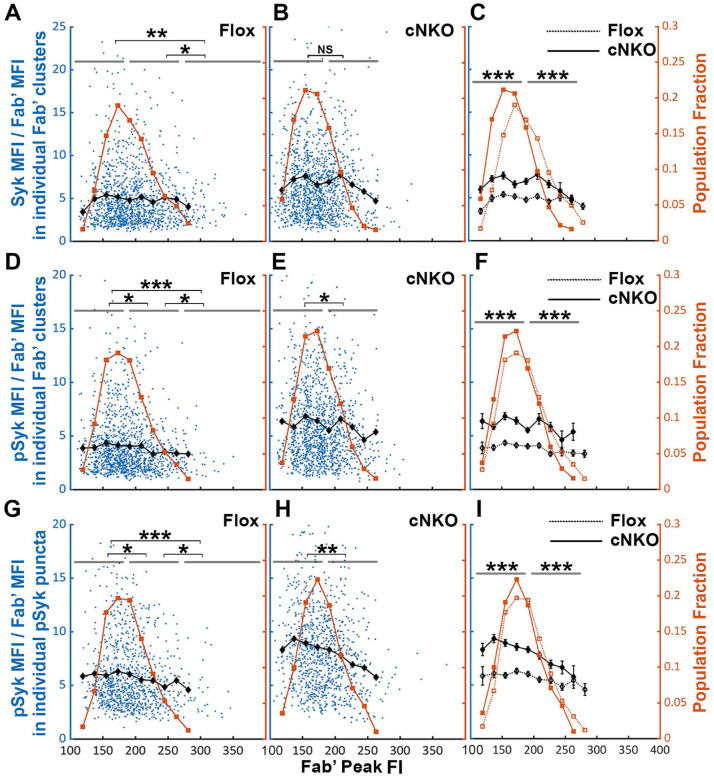
Figure 8. Effects of BCR-Fab’ density on the association of Syk with BCR-Fab’ clusters and its phosphorylation.
Primary B-cells from flox control and cNKO mice were incubated with AF546-Fab’-PLB at 37°C, fixed at 3 or 7 min, stained for total Syk and phosphorylated Syk (pSyk Y519/520), and imaged by TIRF. (A-C) Ratios of Syk MFI relative to AF546-Fab’ MFI were plotted against AF546-Fab’ peak IF in individual AF546-Fab’ clusters in the contact zone of Flox control (A) and cNKO B-cells (B) and their overlay (C). AF546-Fab’ clusters were identified as described in Figure 6 and Figure 6-figure supplement 2 from an equal number of cells after 3- and 7-min stimulation. Data points represent individual AF546-Fab’ clusters with an equal number of clusters from each time point. The black diamond symbols represent the average ratios of Syk MFI to Fab’ MFI in individual AF546-Fab’ clusters with indicated Fab’ peak FI ranges. The brown square symbols represent the fraction of the AF546-Fab’ clusters out of the total at indicated Fab’ peak PI ranges. (D-F) Ratios of pSyk MFI relative to AF546-Fab’ MFI were plotted against AF546-Fab’ peak IF in individual AF546-Fab’ clusters in the contact zone of flox control (D) and cNKO B-cells (E) and their overlay (F). (G-I) MFI ratios of pSyk relative to AF546-Fab’ were plotted against AF546-Fab’ peak IF in individual pSyk puncta in the contact zone of Flox control (G) and cNKO B-cells (H) and their overlay (I). pSyk puncta were identified using the criteria: FI ≥1.3 fold of the background outside the B-cell contact zone and diameter ≥250 nm. The black diamond symbols represent the average ratios of pSyk MFI to Fab’ MFI in individual AF546-Fab’ clusters (D-F) or individual pSyk puncta (G-I) at indicated Fab’ peak FI ranges. The brown square symbols represent the fraction of the AF546-Fab’ clusters out of the total at indicated Fab’ peak PI ranges. Data points represent individual AF546-Fab’ clusters (D-F) or pSyk puncta (G and H), collected from an equal number of cells at 3 and 7 min. Data were generated from 3 independent experiments with ~23 cells per condition per experiment. * p <0.05, ** p <0.01, *** p<0.001, by non-parametric student’s t-test, between AF546-Fab’ cluster group with different Fab’ peak FI ranges. The p-values in C, F and I were corrected using the Benjamini-Hochberg/Yekutieli method for false discovery rate control.

