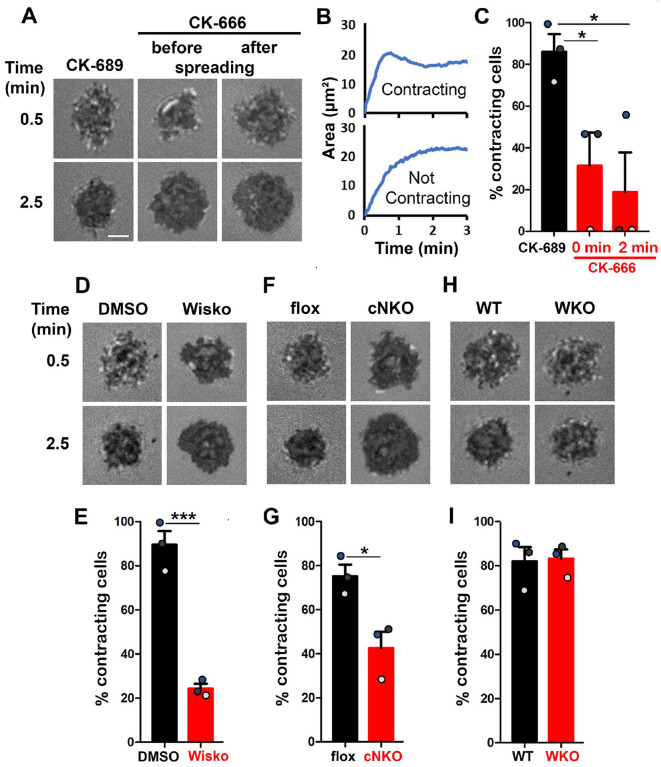
Figure 1. Arp2/3, activated by N-WASP but not WASP, is required for B-cell contraction.
Splenic B-cells were incubated with planar lipid bilayers coated with monobiotinylated Fab’ fragment of goat anti-mouse IgG+M (Fab’-PLB) in the absence and presence of various inhibitors and imaged live at 37°C by interference reflection microscopy (IRM). The B-cell plasma membrane area contacting Fab’-PLB (B-cell contact zone) was measured using IRM images and custom MATLAB scripts. (A) Representative IRM images of splenic B-cells from C57BL/6 mice treated with CK-689 or CK-666 (50 μM) before (0 min) and after maximal spreading (2 min). (B) Representative plots of the B-cell contact area versus time from one contracting cell and one non-contracting cell. (C) Percentages (±SEM) of B-cells that underwent contraction after treatment with CK-666 or CK-689. A B-cell was classified as contracting if its contact zone area was reduced by ≥5% for at least 10 sec after reaching a maximum value. (D) Representative IRM images of splenic B-cells from C57BL/6 mice treated with DMSO or Wiskostatin (Wisko, 10 μM) 10 min before and during incubation with Fab’-PLB. (E) Percentages (±SEM) of B-cells that underwent contraction after treatment with Wisko or DMSO. (F) Representative IRM images of splenic B-cells from flox control and B-cell-specific N-WASP knockout (cNKO) mice. (G) Percentages (±SEM) of cNKO or flox control B-cells that underwent contraction. (H) Representative IRM images of splenic B-cells from WT or WASP knockout mice (WKO). (I) Percentages (±SEM) of WKO or WT B-cells that underwent contraction. Data points in C, E, G, and I represent three independent experiments, ~25 cells per condition per experiment, with each color representing one experiment. Scale bar, 2 μm. *p <0.05, ***p<0.001, by paired student’s t-test.

