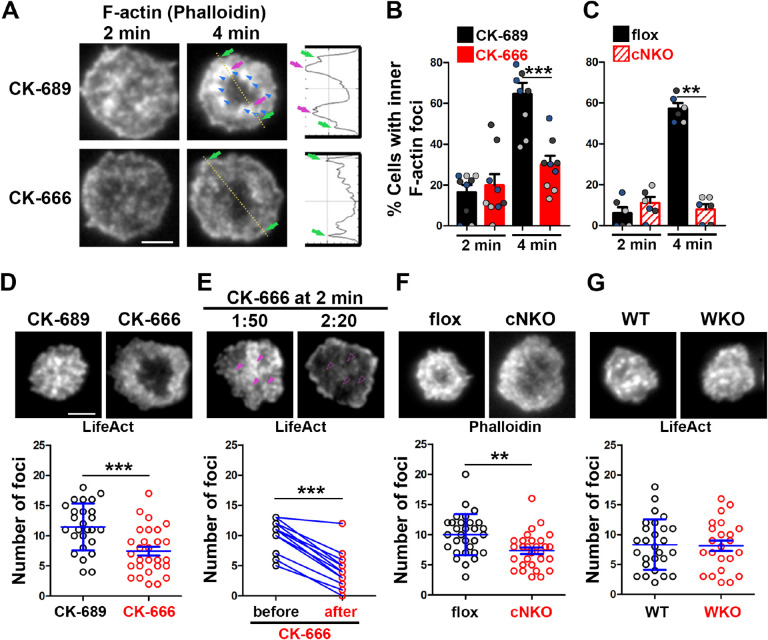
Figure 2. Arp2/3, downstream of N-WASP, generates inner F-actin foci, driving B-cell contraction.
(A-C) WT splenic B-cells were treated with CK-689 or CK-666 (50 μM) during incubation with Fab’-PLB (A and B), and flox control and cNKO B-cells were incubated with Fab’-PLB at 37°C (C). Cells were fixed at 2 and 4 min, permeabilized, stained for F-actin with phalloidin, and analyzed using TIRF. Shown are representative TIRF images of phalloidin staining in the contact zone of CK-689 and CK-666-treated B-cells (A, left panels) and fluorescence intensity (FI) profiles of phalloidin staining along a line crossing cells (A, right panels). Green arrows indicate lamellipodial F-actin, purple arrows indicate inner F-actin foci on the line, and blue arrows indicate all inner actin foci forming a ring-like structure. Percentages of cells (per image) (±SEM) with inner F-actin foci forming ring-like distribution among CK-689-versus CK-666-treated cells (B) and flox control versus cNKO B-cells (C) before (2 min) and after (4 min) contraction were determined by visual inspection of phalloidin FI line-profiles across the B-cell contact zones. Data points in B and C represent 3 independent experiments, with each color representing one experiment, 5 images per condition per experiment, and ~15 cells per image. (D-G) Inner F-actin foci were identified by their diameter (≥250 nm), peak FI (≥2 fold of no foci area, and location (1 μm away from the outer edge) and quantified as the number per cell using TIRF images. (D) Shown are representative images of splenic B-cells from LifeAct-GFP-expressing mice treated with CK-689 or CK-666 from 0 min during incubation with Fab’-PLB at 37°C (top) and the average number (±SEM) of inner LifeAct-GFP foci per cell (bottom) at 2 min. (E) LifeAct-GFP B-cells were treated with CK-666 at 2 min. Shown are representative TIRF images of LifeAct-GFP in the contact zone of B-cells (top) and the average number (±SEM) of inner LifeAct-GFP foci (bottom) in the same cell 10s before and 20s after CK-666 treatment. Arrows indicate disappeared actin foci after CK666 treatment. (F) Shown are representative TIRF images of phalloidin-staining in the contact zone of flox control and cNKO B-cells after incubating with Fab’-PLB for 2 min (top) and the average number (±SEM) of inner F-actin foci per cell (bottom). (G) Shown are representative TIRF images of WT and WKO B-cells expressing LifeAct-GFP incubated with Fab’-PLB for 2 min and the average number (±SEM) of inner F-actin foci per cell (bottom). Data points represent individual cells from three independent experiments with 10 (D, F, and G) or 6 (E) cells per condition per experiment. Scale bar, 2 μm. ** p <0.01, *** p<0.001, by non-parametric student’s t-test.

