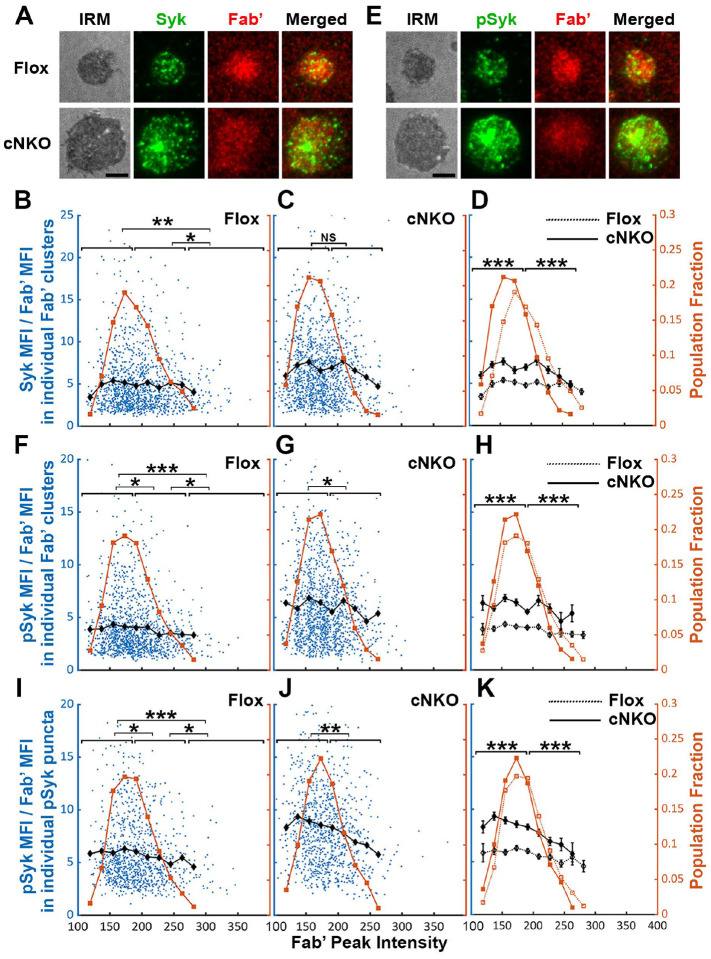
Figure 8. Effects of BCR-Fab’ density on the association of Syk with BCR-Fab’ clusters and its phosphorylation.
Primary B-cells from flox control and cNKO mice were incubated with AF546-Fab’-PLB at 37°C, fixed at 3 or 7 min, stained for total Syk and phosphorylated Syk (pSyk Y519/520), and imaged by IRM and TIRF. (A) Representative IRM and TIRF images of Syk staining in a flox control versus a cNKO B-cell at 7 min (Scale bars, 2 μm). (B-D) Ratios of Syk MFI relative to AF546-Fab’ MFI were plotted against AF546-Fab’ peak IF in individual AF546-Fab’ clusters in the contact zone of Flox control (B) and cNKO B-cells (C) and their overlay (D). AF546-Fab’ clusters were identified as described in Figure 6 and Figure 6-figure supplement 2 from an equal number of cells after 3- and 7-min stimulation. Blue dots represent individual AF546-Fab’ clusters with an equal number of clusters from each time point. The black line and diamond symbols represent the average ratios of Syk MFI to Fab’ MFI in individual AF546-Fab’ clusters at indicated Fab’ peak FI ranges. The brown line and square symbols represent the fraction of the AF546-Fab’ clusters out of the total at indicated Fab’ peak FI ranges. (E) Representative IRM and TIRF images of pSyk staining in a flox control versus a cNKO B-cell at 7 min (Scale bars, 2 μm). (F-H) Ratios of pSyk MFI relative to AF546-Fab’ MFI were plotted against AF546-Fab’ peak IF in individual AF546-Fab’ clusters in the contact zone of flox control (F) and cNKO B-cells (G) and their overlay (H). Blue dots represent individual AF546-Fab’ clusters with an equal number of clusters from each time point. The black line and diamond symbols represent the average ratios of pSyk MFI to Fab’ MFI in individual AF546-Fab’ clusters at indicated Fab’ peak FI ranges. The brown line and square symbols represent the fraction of the AF546-Fab’ clusters out of the total at indicated Fab’ peak FI ranges. (I-K) MFI ratios of pSyk relative to AF546-Fab’ were plotted against AF546-Fab’ peak IF in individual pSyk puncta in the contact zone of Flox control (I) and cNKO B-cells (J) and their overlay (K). pSyk puncta were identified using the criteria: FI ≥1.3 fold of the background outside the B-cell contact zone and diameter ≥250 nm. Blue dots represent individual pSyk puncta with an equal number of clusters from each time point. The black line and diamond symbols represent the average ratios of pSyk MFI to Fab’ MFI in individual pSyk puncta at indicated Fab’ peak FI ranges. The brown line and square symbols represent the fraction of the pSyk puncta out of the total at indicated Fab’ peak FI ranges. Clusters were divided into three populations based on their peak AF546-Fab’ FI, relatively low (<190), medium (190–280), and high (>280, detected only in contracted cells), and the Syk (B and C) or pSyk (F, G, I, and J) to AF546-Fab’ MFI ratios of the three populations were compared. Data were generated from 3 independent experiments with ~23 cells and ≥125 clusters per condition per experiment. * p <0.05, ** p <0.01, *** p<0.001, by non-parametric student’s t-test, between AF546-Fab’ cluster group with different Fab’ peak FI ranges. The p-values in D, H, and K were corrected using the Benjamini-Hochberg/Yekutieli method for false discovery rate control.

