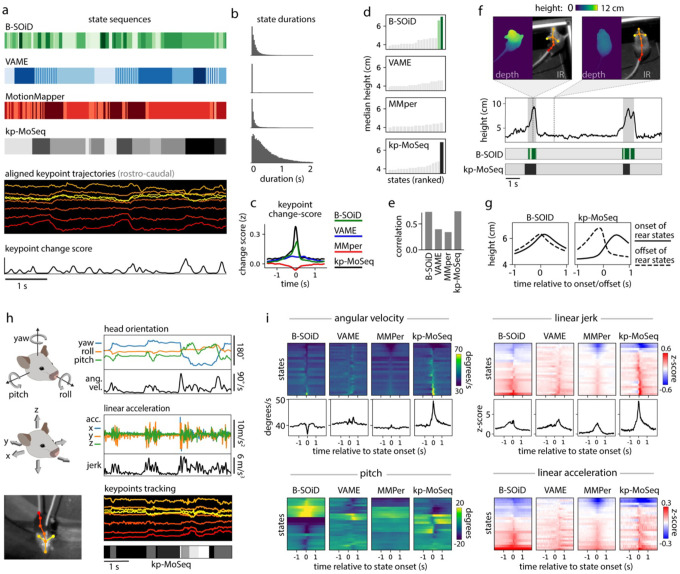
Figure 4: Keypoint-MoSeq captures the temporal structure of behavior.
a) Example behavioral segmentations from four methods applied to the same 2D keypoint dataset. Keypoint-MoSeq transitions (fourth row) are sparser than those from other methods and more closely aligned to peaks in keypoint change scores (bottom row). b) Distribution of state durations for each method in (a). c) Average keypoint change scores (z-scored) relative to transitions identified by the indicated method (“MMper” refers to MotionMapper). d) Median mouse height (measured by depth camera) for each unsupervised behavior state. Rear-specific states (shaded bars) are defined as those with median height > 6cm. e) Accuracy of models designed to decode mouse height, each of which were fit to state sequences from each of the indicated methods. f) Bottom: state sequences from keypoint-MoSeq and B-SOiD during a pair of example rears. States are colored as in (d). Top: mouse height over time with rears shaded gray. Callouts show depth- and IR-views of the mouse during two example frames. g) Average mouse height aligned to the onsets (solid line) or offsets (dashed line) of rear-specific states defined in (d). h) Signals captured from a head-mounted inertial measurement unit (IMU), including absolute 3D head-orientation (top) and relative linear acceleration (bottom). Each signal and its rate of change, including angular velocity (ang. vel.) and jerk (the derivative of acceleration), is plotted during a five second interval. i) IMU signals aligned to the onsets of each behavioral state. Each heatmap row represents a state. Line plots show the median across states for angular velocity and jerk.

