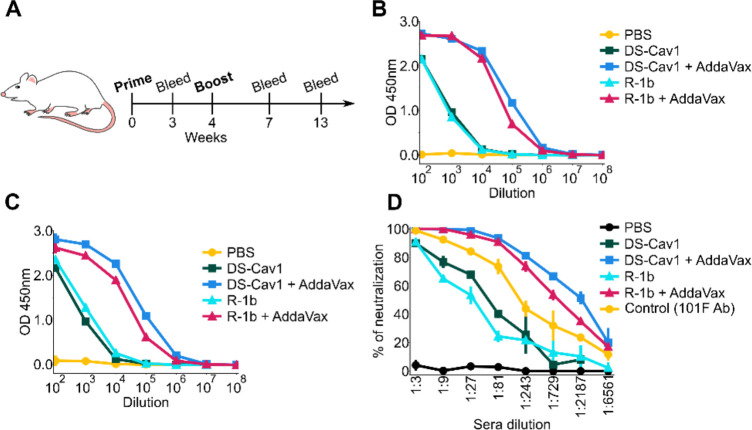
Figure 4. Immunogenicity assessment of R-1b in a mouse model using 0.2ug doses.
(A) Schematic diagram of vaccination study schedule. (B) Serum RSV-specific IgG measured by ELISA three weeks post-boost. (C) Serum RSV-specific IgG measured by ELISA nine weeks post-boost. (D) Serum neutralization titers determined using RSV A (rA2 strain L19F) and sera from mice nine weeks post-boost. Vertical lines represent the standard deviation of three repetitions using pooled serum samples from mice in each immunization group (5 animals/group).

