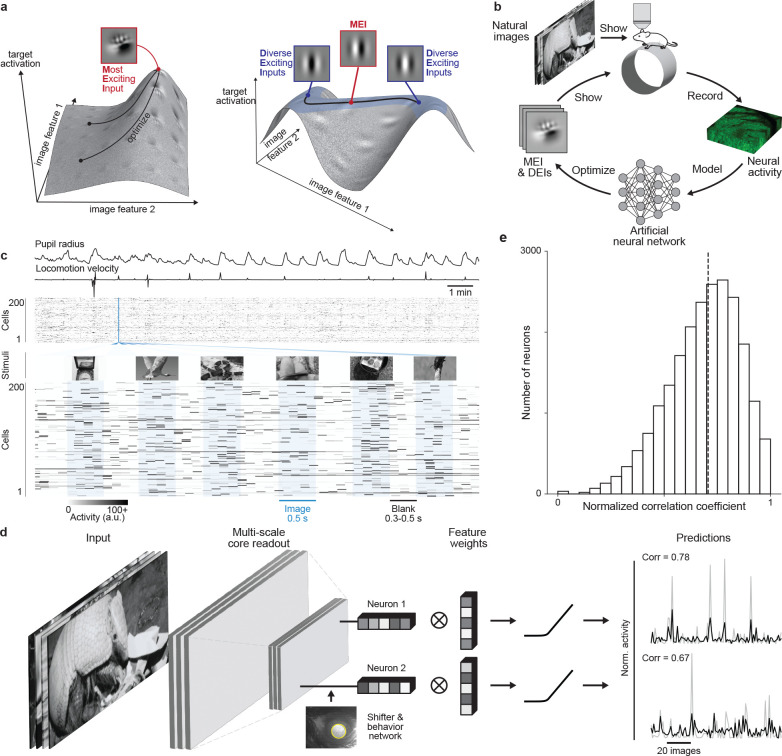
Fig. 1. Deep neural network well captures mouse V1 responses to natural scenes.
a, Illustration of the optimization of Most Exciting Inputs (MEI) and Diverse Exciting Inputs (DEIs).The vertical axes represent the activation of a model neuron with no obvious invariance (left) and another model neuron with phase invariance to its optimal stimulus (right) as a function of two example image dimensions. The black curves depict optimization trajectories of the same MEI (left) starting from different initializations and of the DEIs (right) as different perturbations starting from the MEI along the invariance ridge. b, Schematic of the inception loop paradigm. On day 1, we presented sequences of natural images and recorded in vivo neuronal activity using two-photon calcium imaging. Overnight, we trained an ensemble of CNNs to reproduce the measured neuronal responses and synthesized artificial stimuli for each target neuron in silico . On day 2, we showed these stimuli back to the same neurons in vivo to compare the measured and the predicted responses. c, We presented 5,100 unique natural images to an awake mouse for 500 ms, interleaved with gray screen gaps of random length between 300 and 500 ms. A subset of 100 images was repeated 10 times each to estimate the reliability of neuronal responses. Neuronal activity was recorded at 8 Hz in V1 L2/3 using a wide-field two-photon microscope. Behavioral traces including pupil dilation and locomotion velocity were also recorded. d, Schematic of the CNN model architecture. Our network consists of a 3-layer convolutional core followed by a single-point readout predicting neuronal responses, a shifter network accounting for eye movements, and a behavior modulator predicting an adaptive gain for each neuron (10, 12). Traces on the right show average responses (gray) to test images of two example neurons and corresponding model predictions (black). e, Normalized correlation coefficient (CCnorm, see Methods) (14) between measured and predicted responses to test images for all 22,083 unique neurons across 10 mice selected for MEI and DEIs generation, a metric measuring the fraction of variation in neuronal responses to identical stimuli accounted for by the model prediction(median = 0.71 as indicated by the dashed line). Neurons with CCmax smaller than 0.1 (0.31%) were excluded and CCnorm larger than 1 (1.19%) were clipped to 1 in the histogram.

