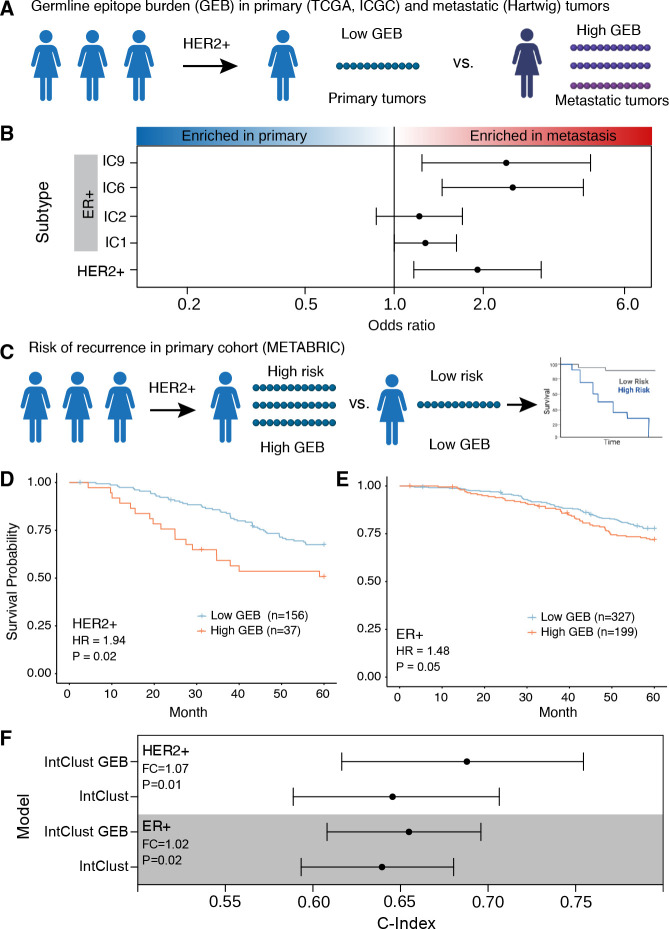
Figure 3 – Tumors that overcome a high burden of germline epitopes are more aggressive.
A) Schematic of within-subtype comparison between GEB in primary tumors (TCGA and ICGC) vs metastatic tumors (Hartwig). B) Across five subtypes, metastatic tumors show an enrichment of epitopes compared to primary tumors. Forest plot shows odds ratio and 95% confidence intervals from meta-analysis of TCGA vs Hartwig and ICGC vs Hartwig. C) Schematic of within-subtype comparisons of GEB association with risk of relapse within five years in METABRIC. D-E) A high GEB is associated with increased risk of relapse in HER2+ (D) and ER+ (E) tumors. Hazard ratio and p-value from CoxPH model correcting for first two genetic principal components, percent genome altered and age. F) GEB in combination with the Integrative Clusters (IntClust) improves the accuracy of five-year relapse prediction in ER+ and HER2+ tumors. Forest plot shows c-index of predictive models considering the IntClust alone or in combination with GEB for 1,000 bootstrapped iterations. Fold change (FC) is calculated as the ratio of medians while the p-value is calculated as 1 – the proportion of iterations where the -index of the IntClust and GEB model was greater than the IntClust alone model.

