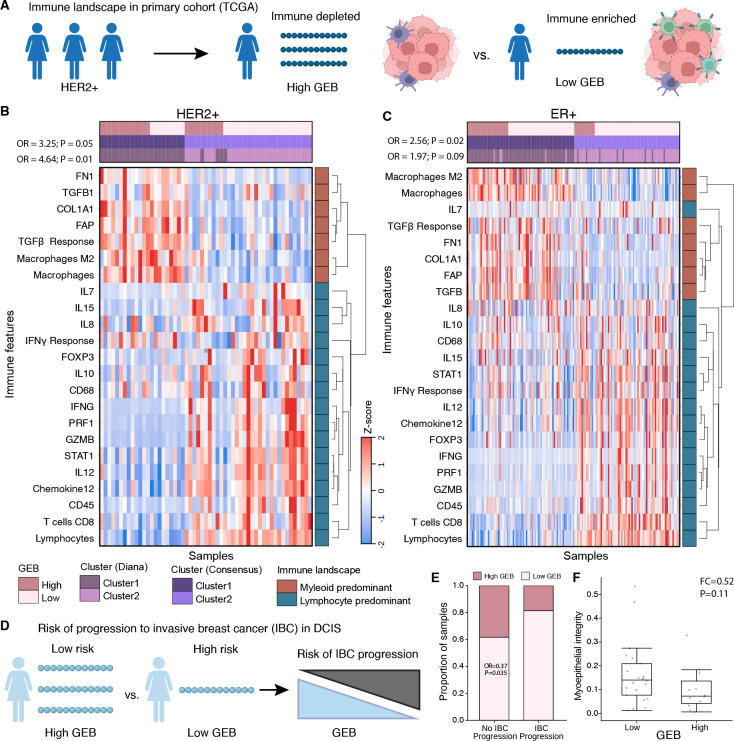
Figure 4 – A high germline epitope burden promotes an immunosuppressive phenotype.
A) Schematic of within-subtype comparisons of the immune landscape between high GEB and low GEB tumors in TCGA. B-C) Unsupervised clustering of 23 immune features, selected to reflect broad immune cell populations, cytokine signaling and extracellular matrix composition, identified two dominant clusters within HER2+ (B) and ER+ (C) breast tumors driven by GEB. Heatmap shows the z-score of each immune feature (y-axis) for each tumor (x-axis). Covariates along the top indicate if the tumor has a high GEB or a low GEB along with clusters from two different clustering methods (Diana and Consensus). Immune features cluster into two broad categories, myeloid and lymphocyte predominant, as indicated by the covariate on the right. Statistics from Fisher’s exact test quantifying the enrichment of high GEB tumors in the myeloid predominant cluster for both clustering methods. D) Schematic of GEB association with progression to invasive breast cancer. E) DCIS lesions that do not progress to IBC are enriched for high GEB. Barplot shows the proportion of DCIS lesions that progress or not progress to IBC stratified by GEB. Statistics from a logistic regression model correcting for eight genetic principal components, HER2 and ER status. F) Myoepithelial integrity is negatively associated with GEB. Boxplot shows myoepithelial integrity (% of E-cadherin in myoepithelium), as defined by Risom et al. (43), in high vs low GEB lesions for a subset of lesions that had spatial proteomics data. Statistics are based on a Mann-Whitney Rank Sum test.

