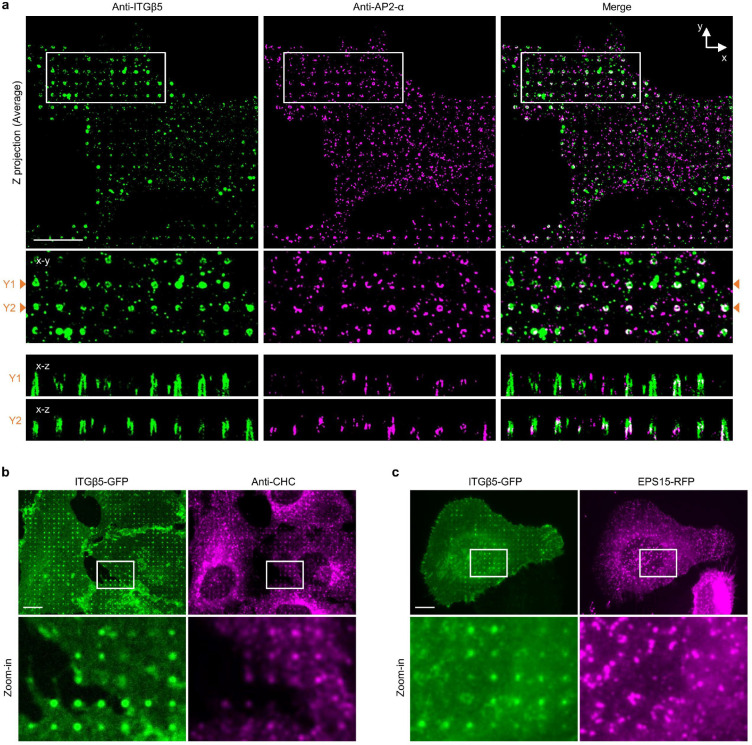
Extended Data Fig. 8: Expansion microscopy shows that integrin β5 and AP2 are not spatially correlated at the nanopillar-membrane interface, and the integrin β5 is not spatially correlated with clathrin and EPS15 at nanopillars.
a, Expansion microscopy is used to increase the spatial resolution of optical imaging for the nanopillar-membrane interface (see the method section and Ref. 32 for detailed descriptions). Both ITGβ5 and AP2-α are immunolabeled. Top row: x-y images of the Z projection (Average) and zoom-in images of the area indicated by white boxes. Bottom: x-z images showing the distribution of immunolabeled ITGβ5 and AP2-α along nanopillars at y = Y1 and y = Y2 in the zoom-in images. Even when ITGβ5 and AP2-α accumulate on the same nanopillar in the x-y image, they are not correlated in the z-dimension. b, Both ITGβ5-GFP and immunolabeled clathrin heavy chain (CHC) accumulate at vitronectin-coated nanopillars, but their intensities are not correlated, i.e. nanopillars with high intensities of ITGβ5-GFP are usually not the nanopillars with high intensities of anti-CHC. c, ITGβ5-GFP accumulates at vitronectin-coated nanopillars, but the co-transfected EPS15-RFP does not show strong accumulation or correlation with ITGβ5-GFP at these nanopillars. Scale bars: 10 μm.

