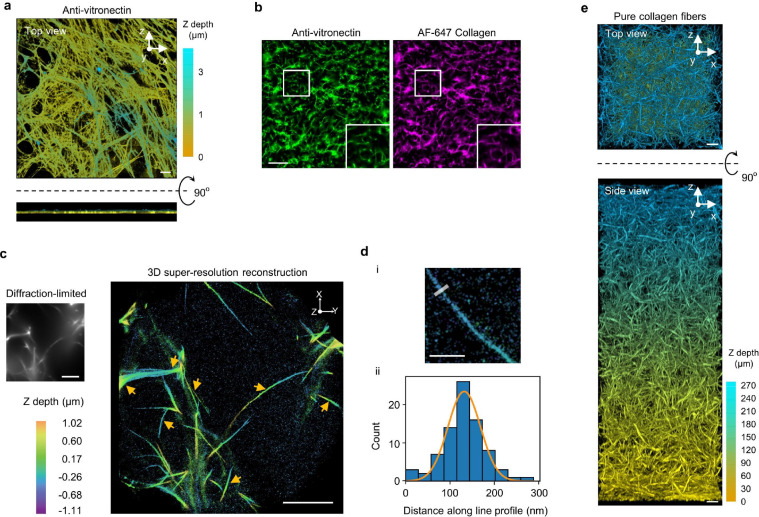
Extended Data Fig. 12: Characterizations of cell-derived ECM, 3D ECM, and individual fibres.
a, Anti-vitronectin staining illustrates the fibre morphology of IMR-90 lung fibroblast-derived ECM. Z-depth is colour-coded. These cell-derived fibres are dense and flat (< 1 μm thickness) on the glass surface. b, In 3D ECM made of vitronectin fibres, colocalization of AF647-collagen with immunolabeled vitronectin confirmed the incorporation of vitronectin in collagen fibres. Scale bar: 50 μm. c, 3D super-resolution reconstruction of AF 647-collagen fibres. The widefield diffraction-limited image (top left) depicts collagen fibres. The Z projection of the 3D super-resolution reconstruction (right) reveals higher resolution structures of the collagen fibres in the diffraction-limited image. Yellow arrows point to some individual collagen fibres. Colour encodes the z position. Scale bars: 5 μm. d, Extracting the diameter of individual fibres. (i) The image shows an example of a resolved individual fibre. Transverse line profiles (representative example shown at top) are taken across the fibre to estimate its diameter. Scale bar, 1 μm. (ii) Localizations from the line profile are binned into a histogram which is then fit to a Gaussian function (orange line). The full width at half maximum is extracted to estimate the diameter. The line profile in (i) yields the histogram and the fitting is depicted in (ii). e, Representative fluorescence images (3D projection, top and side views) of a thick layer (~ 270 μm) of 3D ECM made of pure collagen fibres labelled with AF647-collagen. Z depth is colour coded. Scale bars: 10 μm.

